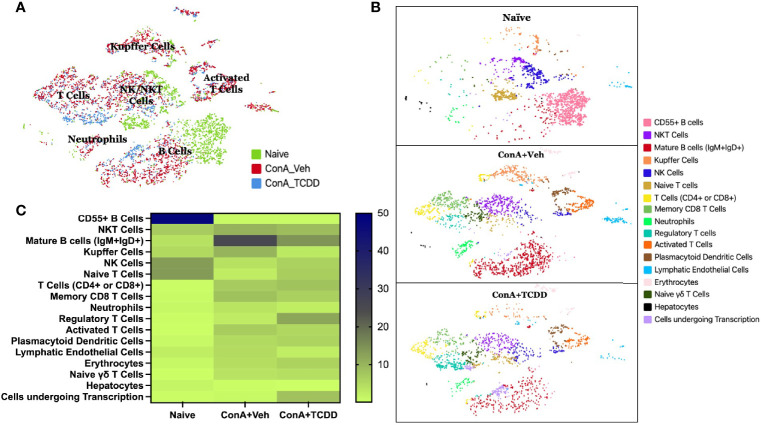
Figure 3.
Identification of changes in cellular types following ConA-induced hepatitis using scRNA-seq. C57/BL6 mice were injected with ConA followed by vehicle or TCDD 1 hour later as described in Figure 1 legend. Liver infiltrating cells were isolated and scRNA-seq was performed as described in Methods. (A) tSNE plot with each treatment group separated by color and main clusters labeled. (B) tSNE plot separated by sample group and colored to show varying stages of activation and differentiation (C) Heatmap of the percentages of cells contained in each tSNE cluster with the increases in the percentage shown by the change in color from light to dark.

