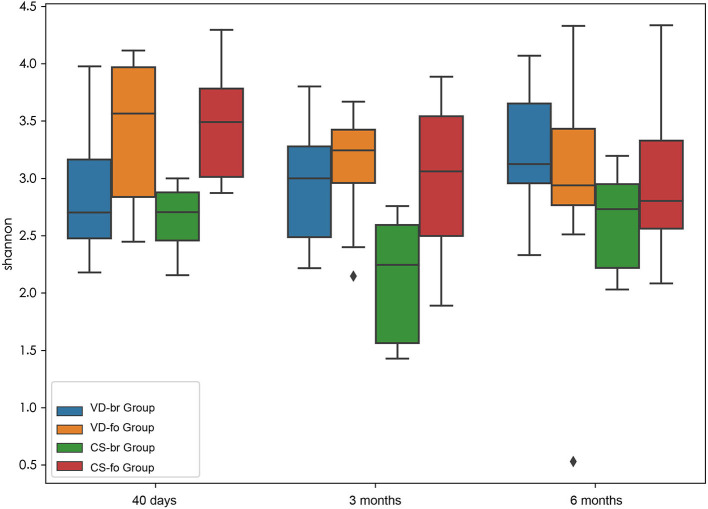
Figure 1.
α diversity measurements using Shannon index values indicated gut microbiota diversity. Y-axis represents the values of Shannon index. Boxplots compare α diversity of gut microbiota in 40 days (40 d), 3 months (3 m), and 6 months (6 m) of age among different groups. Boxes show 25th to 75th percentiles and the median line, and whiskers indicate minimum to maximum values. Statistical significance was evaluated by Wilcoxon test within each group and a two-tailed t test among different groups, using p ≤ 0.05 as the measure of significance.

