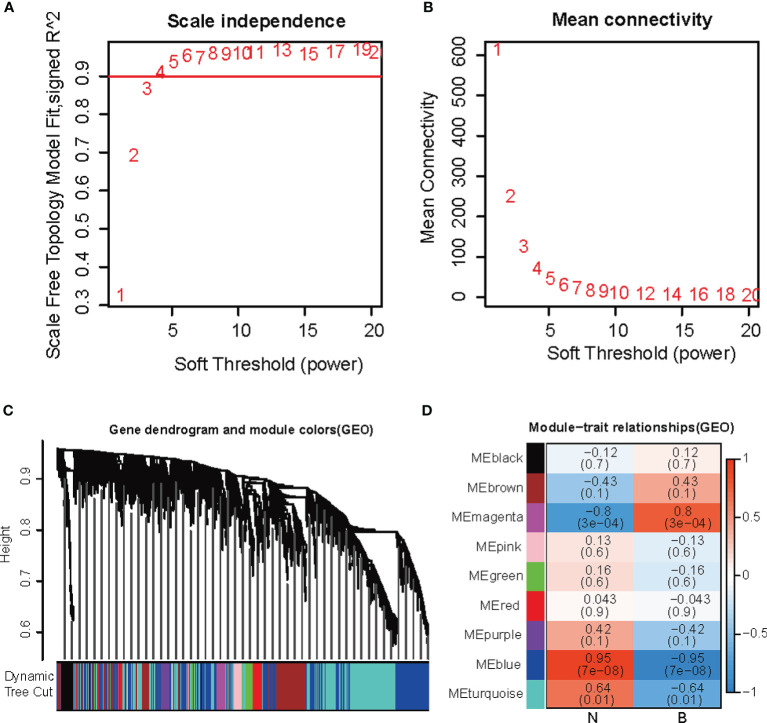
Figure 2.
WGCNA co-expression network analysis (A) Escale-free fitting index. (B) Mean connectivity. (C) Each branch in the tree represented a gene, and the color of each module was on behalf of a co-expression module. (D) The heatmap for the correlation between the epigenome and early DKD formation traits.

