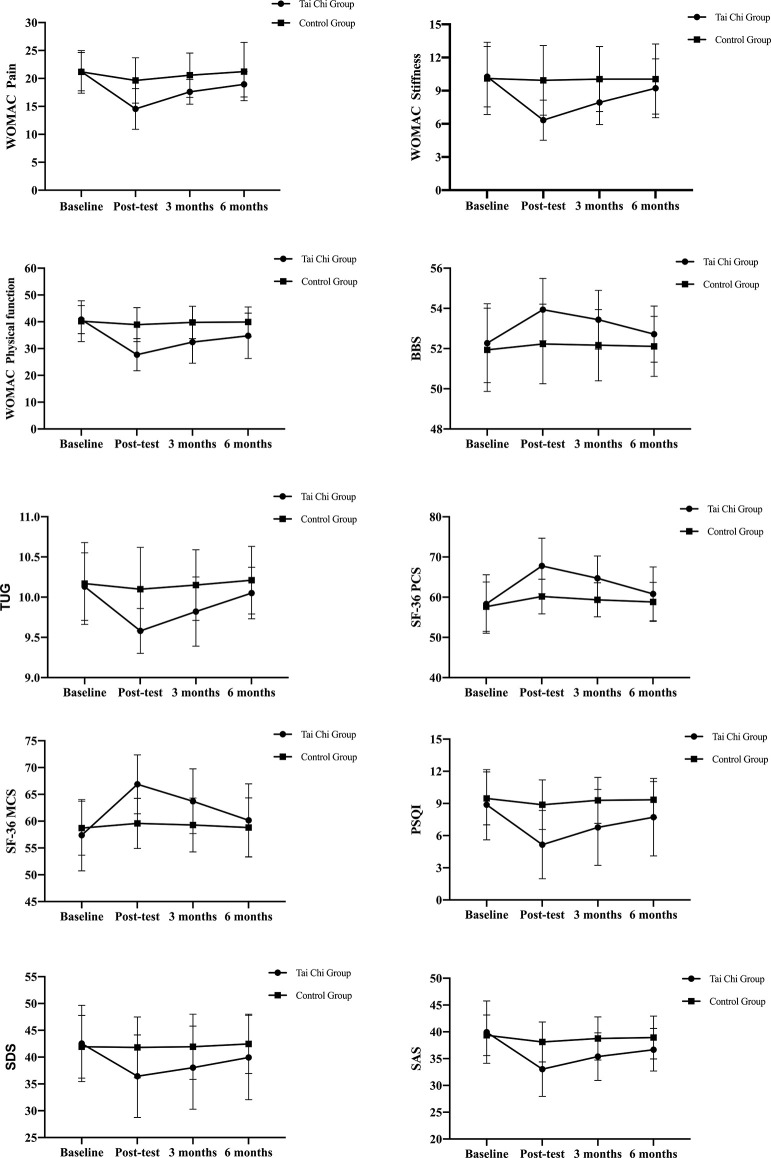
Figure 2.
The changes in the indicators of the two groups at Baseline, 12 weeks, follow-up 3 months, and 6 months over time. The value is the mean ± standard deviation (SD); error bars show the 95% confidence interval. WOMAC, The Western Ontario and McMaster Universities Osteoarthritis Index; BBS, Berg balance scale; TUG, time up go; SF-36, The MOS item short-form health survey; MCS, Mental component summary; PCS, Physical component summary; PSQI, Pittsburgh sleep quality index; SAS, Self-rating Anxiety Scale; SDS, Self-rating Depression Scale.

