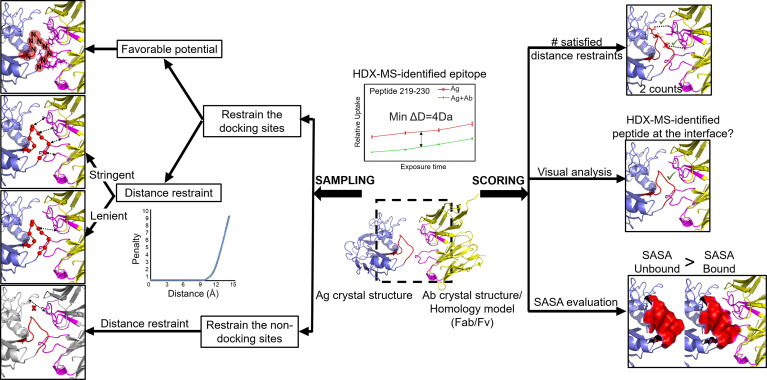
Figure 6.
Different practices have been used to incorporate HDX-MS data into Ab-Ag docking. HDX-MS data are provided in form of identified epitope peptides (e.g., peptide 219-230 with a decrease in deuterium level of at least 4Da across 4 timepoints). Docking components: Ag crystal structure (blue; HDX-identified peptide: red) and Ab (Fab or Fv) crystal structure or homology model - (yellow; CDRs: pink). Sampling stage: (A) Restrain the docking sites. Favorable potential (red sphere) - spheres surrounding the backbone N atoms in the epitope are filled with favorable values. Each atom of the Ab lying within this sphere would contribute a favorable potential to the energy function. Distance restraint (left right arrows) - a minimum number of residues from each epitope peptide must be within a specified threshold distance to the Ab. Lenient approach: one residue from the epitope peptide to be at the interface. Stringent approach: the minimum number of contact residues correlates with the decrease in deuterium level (i.e., 4 residues in this case). (B) Restrain the non-docking sites: non-epitope peptides and non-CDR regions (grey) are blocked from docking using distance restraint. Scoring stage: HDX-MS data is applied as filters in form of: the number of satisfied distance restraints is - the higher the count (favorable contact) is, the more optimal a docked pose is considered to be; visual analysis - manually inspection of the docked poses on whether the epitope is at the interface; SASA evaluation - SASA calculation of the epitope peptide in the unbound form must be larger than the bound form.

