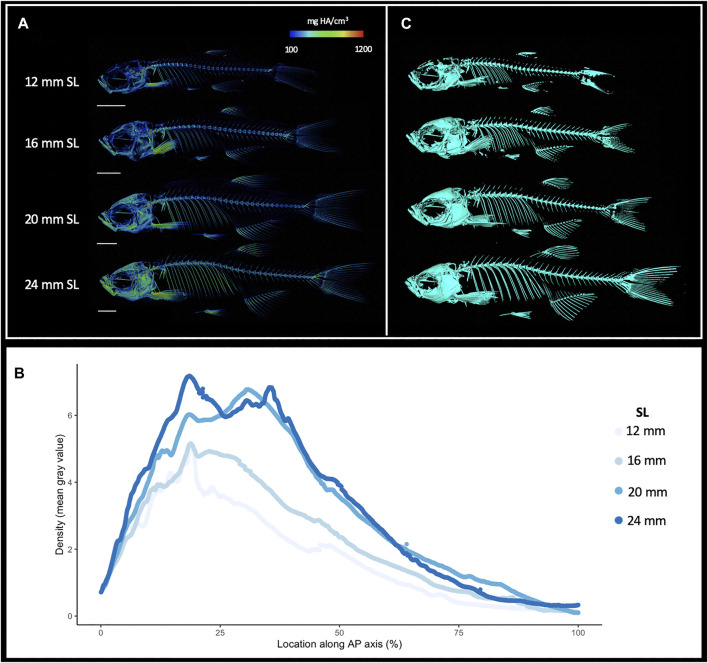
FIGURE 2.
Increasing skeletal density and volume with linear growth. (A), Relative density renderings of skeletons from zebrafish at four different sizes (12, 16, 20, and 24 mm SL). Warmer colors indicate higher density regions. (B), Average density of zebrafish skeleton along the body length of individual zebrafish at four sizes. (C). Volume renderings of zebrafish at four sizes. Scale bars, 2 mm.

