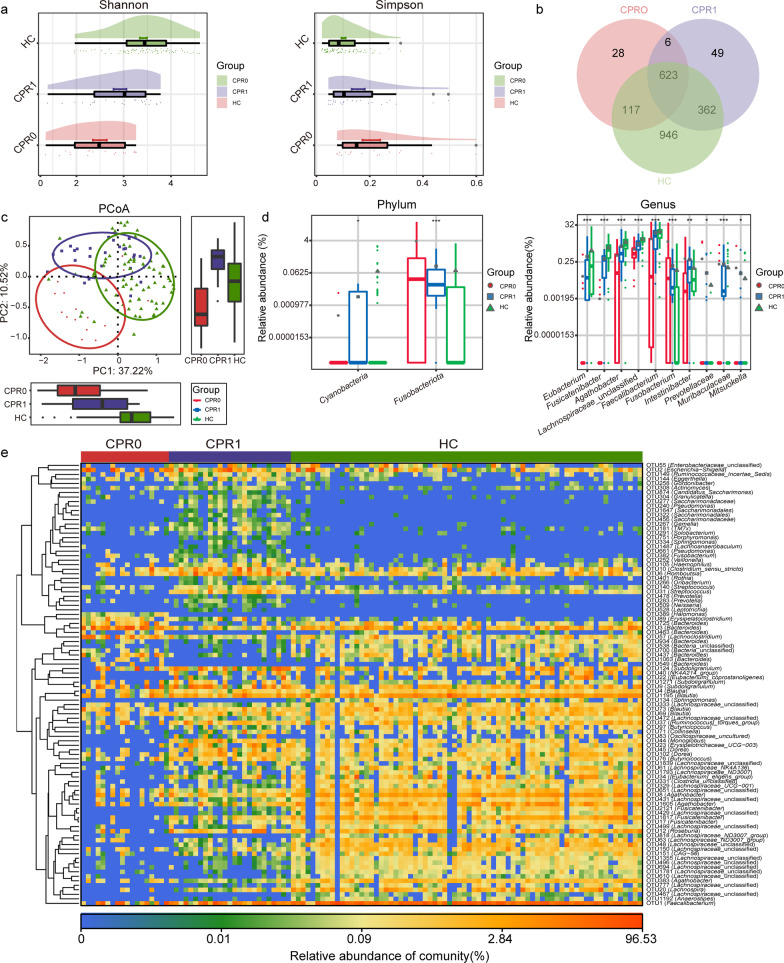
Fig. 3.
Gradual recovery of the gut microbiome. a As estimated by the Shannon index and Simpson index, gut microbial diversity gradually increased during the recovery process. b Venn diagram displayed the shared and different OTUs between the three groups. c PCoA showed that the compositions and diversity gradually recovered. d In the process of recovery, the key gut bacteria whose abundance gradually increased or decreased were identified among three groups. e Heatmap displays the gradual recovery of the key OTUs in the gut microbiome. *P < 0.05, **P < 0.01, ***P < 0.001, compared among three groups. CPR0 confirmed patients recover at discharge, CPR1 confirmed patients recover 1 year, HC healthy control, PCoA principal coordinate analysis, OTUs operational taxonomy units

