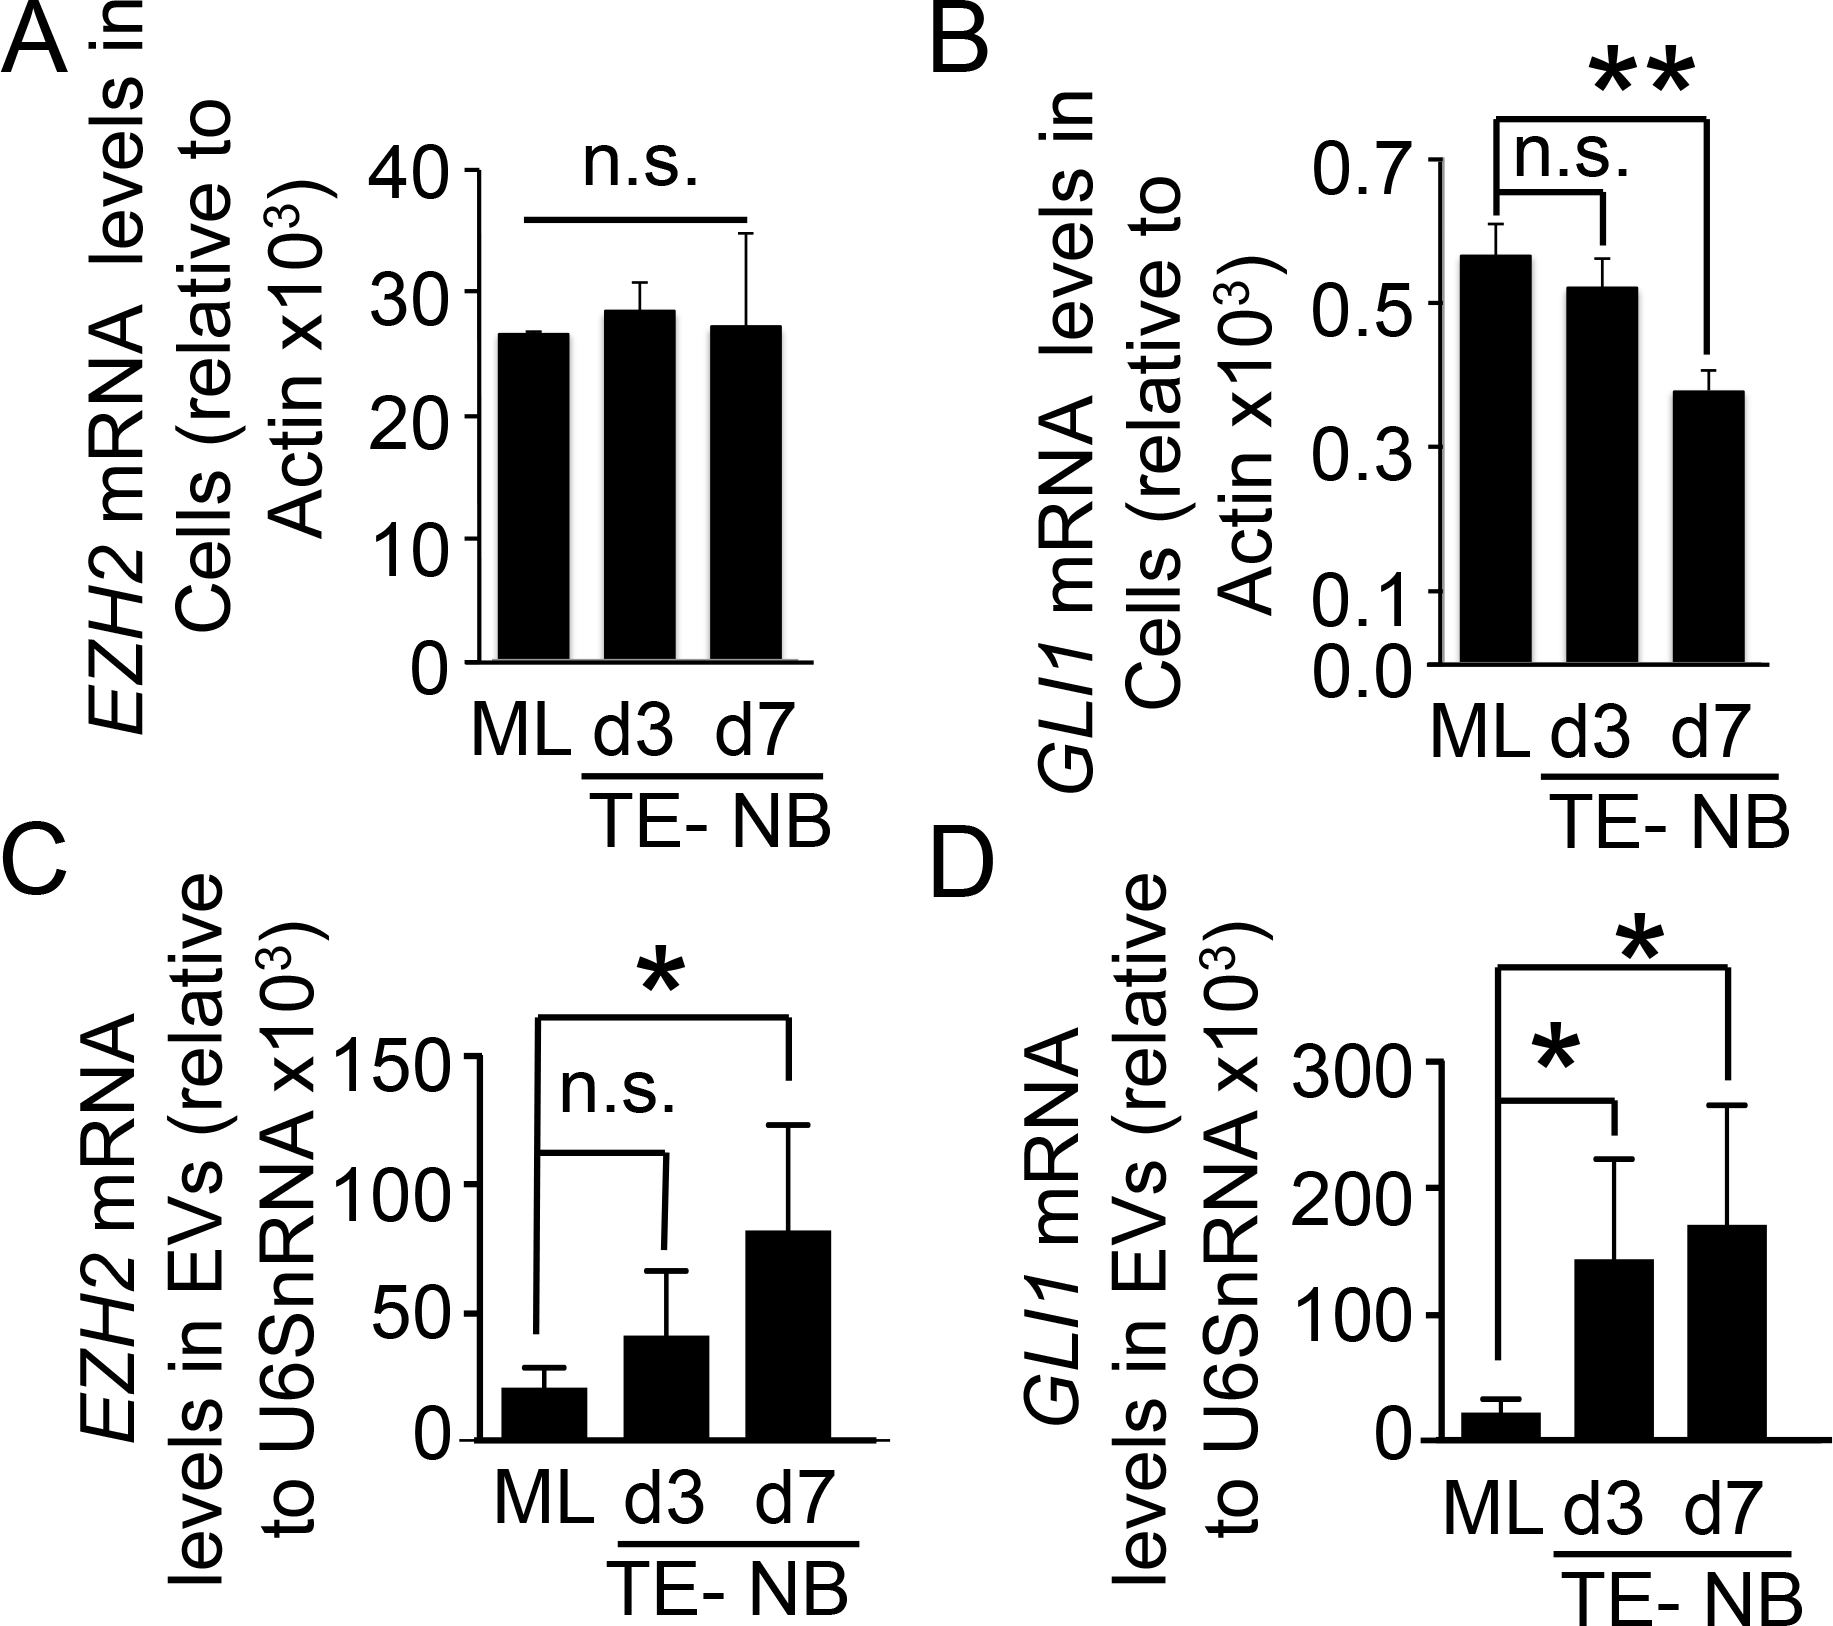
Figure 4. Evaluation of EZH2 and GLI1 mRNAs in N-type NB cells and Extracellular vesicles.

(A) qRT-PCR analysis of EZH2 in the N-type neuroblastoma cell line (SK-N-BE(2)) cultured in monolayer (ML) and in the tissue-engineered model (TE-NB) for 3 and 7 days. In all cases, relative endogenous expression of EZH2 was normalized to actin expression. Two-tailed Studentś t-test was used to determine statistical significance. ns, not significant. (B) qRT-PCR of GLI1 expression in the neuroblastoma cell line SK-N-BE(2) cultured during 3 and 7 days in Col1-HA scaffold (TE-NB) compared to monolayer (ML). Relative endogenous expression of GLI1 was normalized to actin and error bars represent standard deviations of relative expression. Statistical significance was determined by the two-tailed Student’s t test.**p < 0.01; ns, not significant. (C) EZH2 mRNA cargo levels in extracellular vesicles from SK-N-BE(2) cells cultured in monolayer (ML), and in Col1-HA scaffold for 3 and 7 days (TE-NB). EZH2 mRNA amount was normalized to U6SnRNA and error bars represent standard deviations of relative expression. Statistical significance was determined by the two-tailed Student’s t test. *p < 0.05; ns, not significant. (D) GLI1 mRNA detection in extracellular vesicles released from SK-N-BE(2) cultured in monolayer and scaffold (TE-NB) at days 3 and 7 by qRT-PCR. GLI1 mRNA amount was normalized to U6SnRNA and error bars represent standard deviations of relative expression. Statistical significance was determined by the two-tailed Student’s t test. *p < 0.05; ns, not significant.
