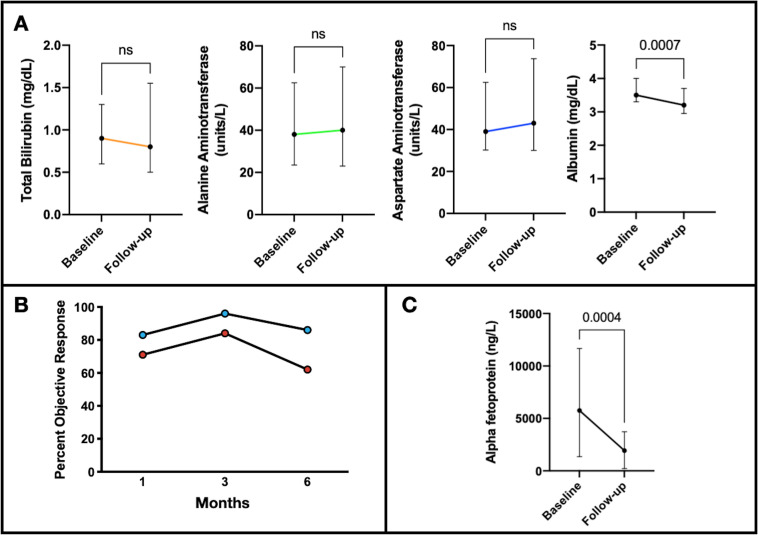
Figure 3.
Laboratory changes and treatment response individual TACE treatments. (A) Median changes of liver function tests from baseline to follow-up after each TACE with available 1-month follow-up labs (n=57) were 0 (IQR −0.3 to 0.6) mg/dL (p=0.40), 5 (IQR −11 to –19) units/L (p=0.21), 2 (IQR −6.8 to –14) units/L (p=0.15), and −0.2 (IQR −0.5 to −0.05) mg/dL (p<0.01), for bilirubin, ALT, AST and albumin, respectively. Treatment response according to imaging mRECIST and AFP response after TACE included (B) overall ORR of 71%, 84%, and 62, and target ORR of 83%, 96%, and 86% at 1, 3, and 6 months, respectively, after the patient’s first TACE. (C) Median change AFP from baseline to follow-up in patients with baseline AFP >400 ng/mL (n=16) was −2749 (IQR −6318 to −599) (p<0.001). AFP, alpha fetoprotein; ALT, alanine aminotransferase; AST, aspartate aminotransferase; mRECIST, modified RECIST; ORR, objective response rate; TACE, transarterial chemoembolization.

