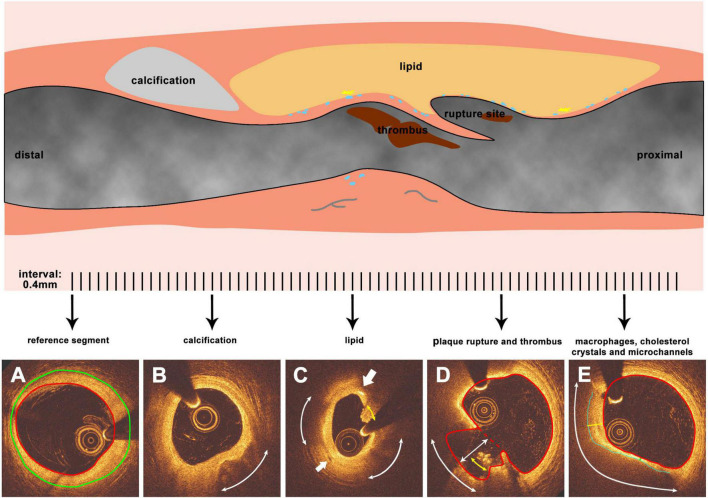
FIGURE 1.
Representative images and methodology of OCT morphology analysis. The upper part is a representative longitudinal diagram of a ruptured plaque (blue dots represent for macrophages while yellow sharp stars for cholesterol crystals, gray curved lines for microchannels), panels (A–E) are cross sections corresponding to the lesion segment while analyzed at 0.4 mm interval. (A) The reference segment of the vessel, red line indicates the lumen surface while green line indicates the EEM. (B) Calcification tissue in the plaque, the arc indicates the calcific arc. (C) Lipid tissue in the plaque, the arc indicates the lipid arc, the area enclosed by the blue line indicates the fibrous cap. Yellow and green lines which are vertical to the lumen border are maximum and minimal cap thickness respectively. (D) Plaque rupture and thrombus. Red line represents the lumen surface while red dash line indicates the lumen surface before plaque rupture. The white arc represent rupture circumferential extend, while yellow arc indicates thrombus circumferential distribution for generating the thrombus score. Line with arrowheads represents the depth of rupture. (E) Macrophages, cholesterol crystals, and microchannels. The bigger arrow points to the cholesterol crystals while the smaller arrow points to the microchannel. Arcs indicate the arc of macrophages.

