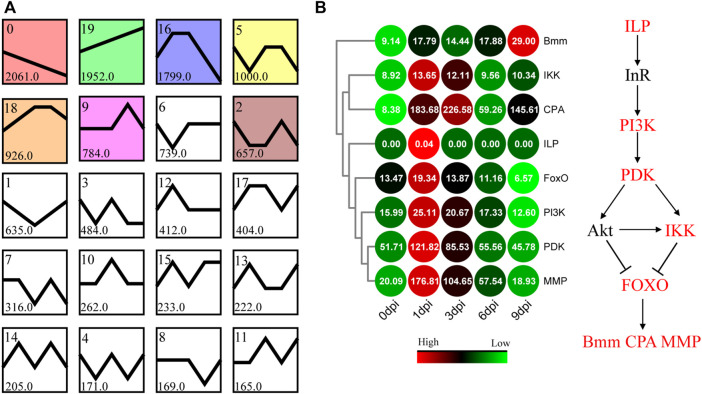
FIGURE 6.
Patterns of gene expression across different time points inferred by the STEM and enrichment analyses. (A) Twenty candidate profiles obtained by the STEM analysis. The six colored profiles are significant profiles (FDR <0.05). (B) Expression pattern of the genes involved in the FOXO signaling pathway. Bmm, CPA, and MMP represent the glyceride lipase Brummer, molting fluid carboxypeptidase A, and matrix metalloproteinase, respectively.

