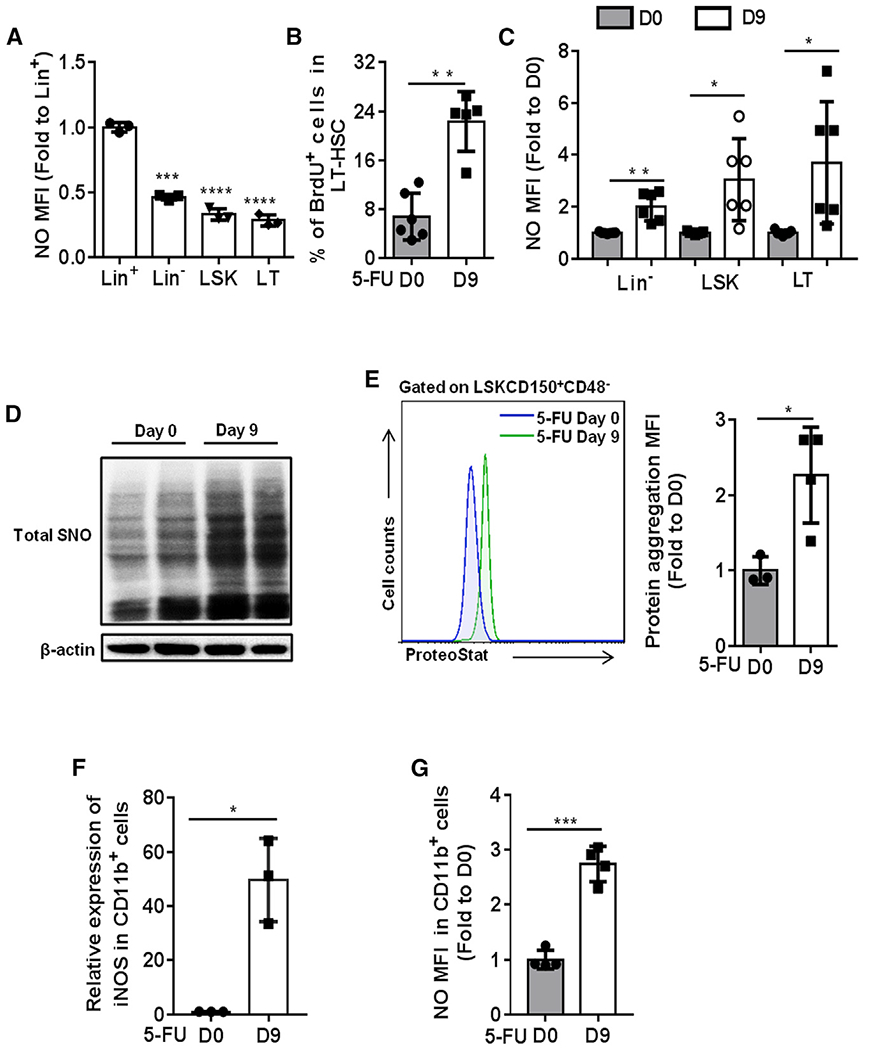
Figure 1. Increase of NO level and protein aggregation in regenerating HSCs.

(A) The levels of NO in freshly isolated Lineage+ (Lin+), Lineage− (Lin−), Lineage−cKit+Sca1+ (LSK), and CD48−CD150+LSK (LT-HSCs) cells from 2-month-old WT mice were detected by DAF-FM DA probe. The data show the relative changes of NO levels in the indicated groups (fold change to the NO level in Lin+ cells; n = 3 per group).
(B) WT mice were treated with a single dose of 5-FU (150 mg/kg) and sacrificed at day 9 post-treatment. BrdU (100 mg/kg) was injected 16 h prior to mice sacrifice. The results present the percentage of BrdU-positive cells in LT-HSCs at the indicated time points after 5-FU treatment (n = 5-6 per group).
(C–G) WT mice were treated with a single dose of 5-FU (150 mg/kg) and sacrificed at day 9 post-treatment.
(C) The data show the relative change of NO levels in the indicated populations (fold change to the NO level in the same population at day 0 post-5-FU treatment; n = 6–7 per group from 2 independent experiments).
(D) The S-nitrosylated proteins in Lin− cells were purified by a biotin-switch method, and the total SNO was detected by western blot with antibody against biotin (n = 2 pools; n = 3 mice per pool).
(E) Representative fluorescence-activated cell sorting (FACS) histogram (left) and the quantification of the level of protein aggresome (right) in LT-HSCs. The value of protein aggresome in LT-HSCs was normalized to the value detected at day 0 (n = 3–4 per group).
(F) The mRNA expression of iNOS relative to β-actin was analyzed in CD11b+ BM cells from the indicated groups (n = 3 per group).
(G) The level of NO was examined in CD11b+ BM cells from the indicated groups (n = 4 per group).
(A–G) Data were tested for normal distribution via Shapiro-Wilk normality test. Statistical significance between two groups of normally distributed data was assessed by Student’s t test with Welch’s correction. Statistical significance of the non-normally distributed data was assessed by Wilcoxon/Mann-Whitney test (B). All data are shown as mean ± SD. *p < 0.05; **p < 0.01; ***p < 0.001; ****p < 0.0001.
