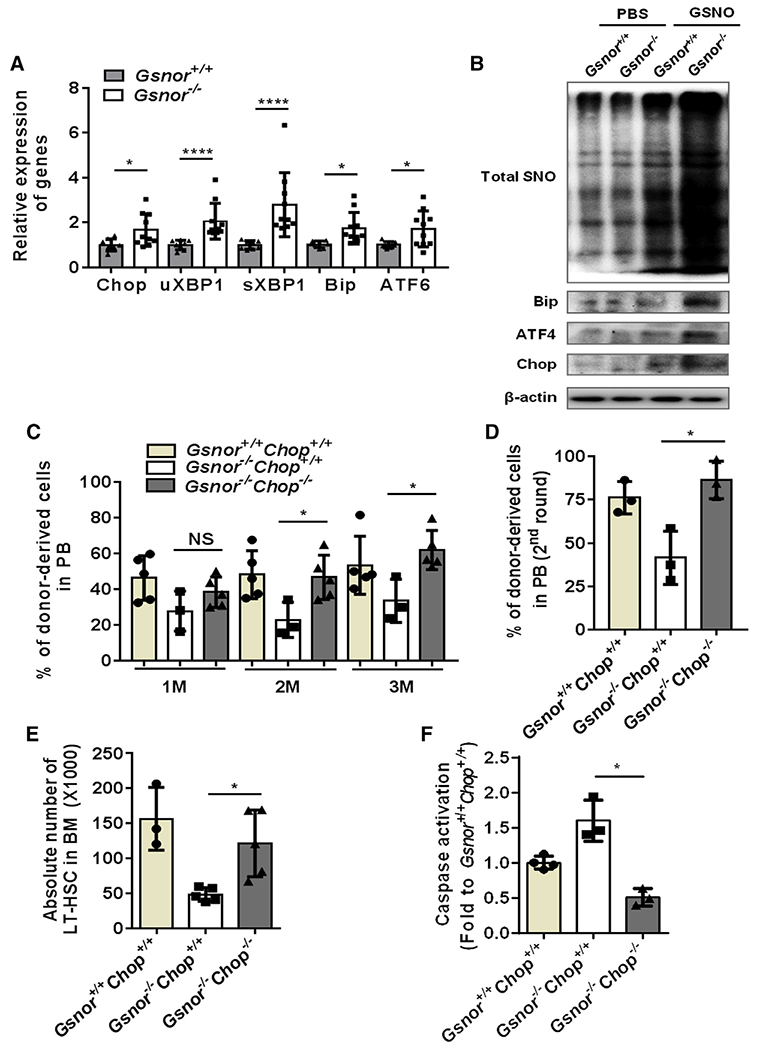
Figure 6. Chop deletion rescues the impaired function of Gsnor−/− HSCs.

(A) Gsnor+/+ mice and Gsnor−/− mice received an i.p. injection of 5-FU (150 mg/kg). The relative expression of the indicated genes to β-actin was measured by qPCR in freshly isolated LT-HSCs from the mice 9 days after 5-FU treatment (n = 8–10 per group).
(B) Gsnor+/+ and Gsnor−/− MEF cells were treated with or without chemical NO donor S-nitrosoglutathione (GSNO), and the total SNO level was detected. Total SNO was detected by western blot with an antibody against biotin. Western blot was performed to detect the expression level of Bip, ATF4, and Chop in Gsnor+/+ and Gsnor−/− MEF cells in the presence or absence of GSNO (n = 2 independent experiments; one of the two is shown, the other shows a similar result).
(C and D) Three hundred LT-HSCs from Gsnor+/+Chop+/+, Gsnor−/−Chop+/+, and Gsnor−/−Chop−/− mice were transplanted into lethally irradiated recipient mice along with 5 × 10⁵ competitor BM cells. 12 weeks later, 1 × 10⁶ BM cells from the primary recipients were transplanted into the secondary recipients.
(C) The results show the percentage of donor-derived cells in PB at the indicated time point after first round of transplantation (n = 3–5 per group).
(D) The data show the chimerism of donor-derived cells in PB 8 weeks after the second round of transplantation (n = 3 per group).
(E and F) Gsnor+/+Chop+/+ mice, Gsnor−/−Chop+/+ mice, and Gsnor−/−Chop−/− mice were treated with a single dose of 5-FU (150 mg/kg) and sacrificed at day 9 post-5-FU treatment for further analyses.
(E) The data show the absolute number of LT-HSCs in the indicated groups (n = 3–5 per group).
(F) The data show the activation of cleaved-caspase-3/7 in LT-HSCs in the indicated groups (the values were normalized to the mean value in LT-HSCs from Gsnor+/+Chop+/+ mice; n = 3–4 group).
(A–F) Data were tested for normal distribution via Shapiro-Wilk normality test. Statistical significance of the two groups of normally distributed data was assessed by Student’s t test with Welch’s correction. Statistical significance of the non-normally distributed data was assessed by Wilcoxon/Mann-Whitney test (A). Data are shown as mean ± SD. *p < 0.05; ****p < 0.0001.
