FIGURE 3.
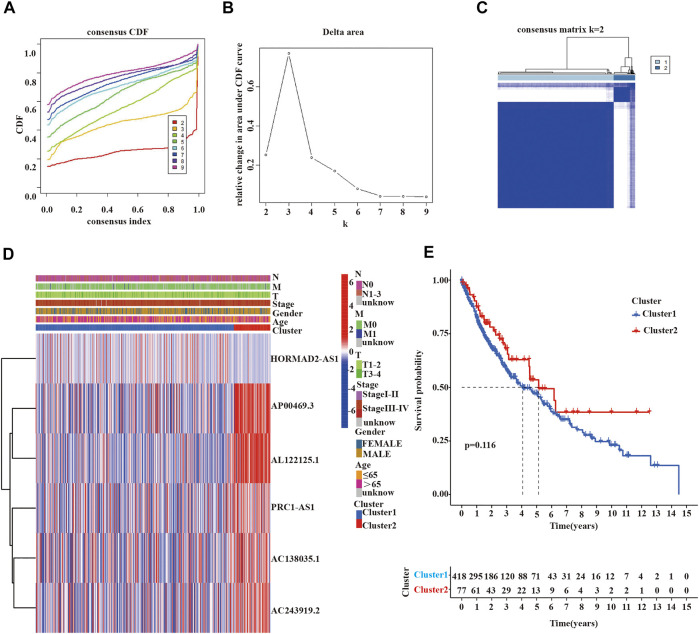
Clinicopathological characteristics and survival analysis of cluster 1/2 subgroups of LUSC. (A,B) Consensus clustering cumulative distribution function (CDF) for k = 2 to 9. (C) Consensus clustering matrix for k = 2. (D) Heatmap of the correlation between the expression levels of 6 m6A-related lncRNAs with prognostic value and clinicopathological features in the TCGA-LUSC dataset (red indicates high expression, blue indicates low expression). (E) Kaplan-Meier curves of overall survival for two clusters in LUSC. LUSC, lung squamous cell carcinoma; m6A, N 6 -methyladenosine; lncRNAs, long non-coding RNAs; TCGA, the cancer genome atlas; Statistical methods: Chi-square test, log-rank test.

