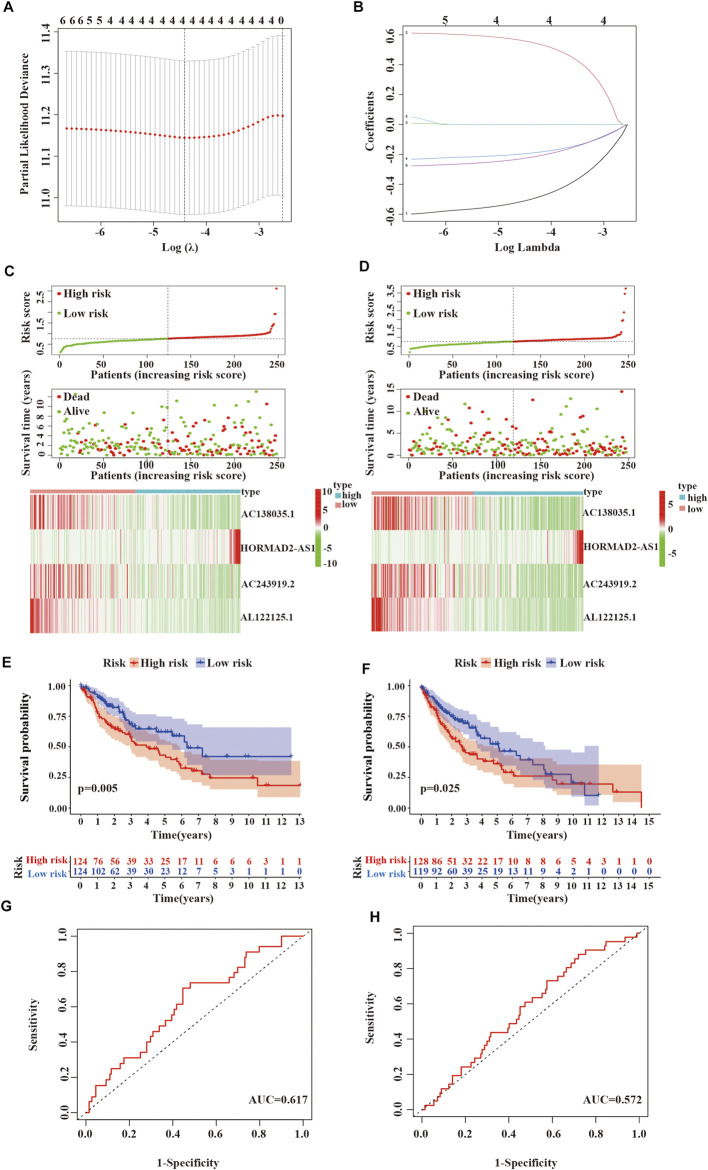
FIGURE 7.
Verifying the risk model. (A,B) LASSO Cox regression analysis of 6 m6A-related lncRNAs with prognostic value. (C) Survival status and expressive heatmap of 4 m6A-LPMs in the training group (red indicates high expression, green indicates low expression). (D) Survival status and expressive heatmap of 4 m6A-LPMs in the test group (red indicates high expression, green indicates low expression). (E,F) Kaplan-Meier curve of 4 m6A-LPMs in the training group (E) and test group (F). (G,H) time-ROC curves of 4 m6A-LPMs in the training group (G) and test group (H). LASSO, the least absolute shrinkage and selection operator; ROC, the receiver operating characteristic curve; m6A-LPMs, m6A-related lncRNA prognostic markers. Statistical methods: Chi-square test, log-rank test.

