
Figure 2c. Estimated survival curves from adjusted cox models for all-cause mortality in the sleep difficulty or comparison conditions, controlling for covariates.
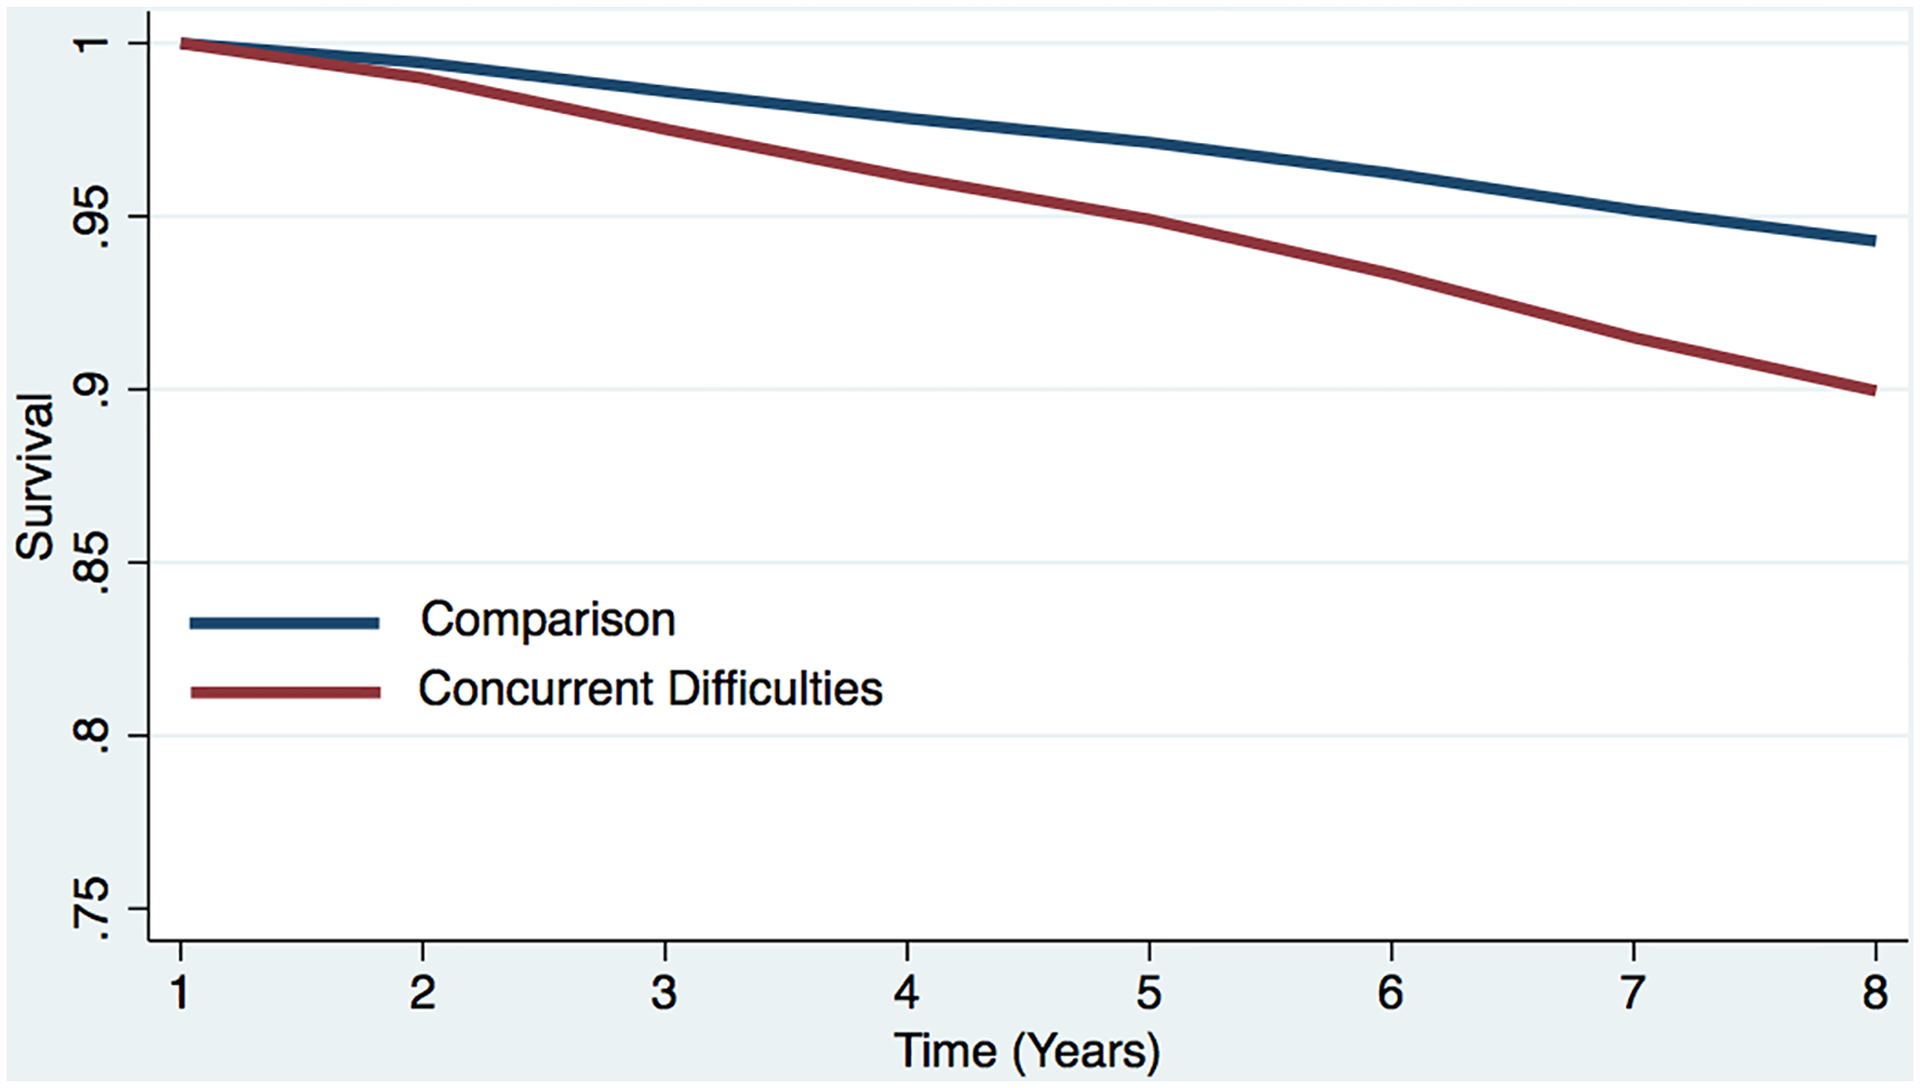
Estimated survival curve from adjusted cox model for all-cause mortality in the concurrent sleep difficulty and comparison conditions, controlling for covariates.
a The red line represents the respondents who reported each sleep difficulty “most nights” or “every night.” In the case of concurrent difficulties, the red line represents the respondents who reported both sleep difficulties “most nights” or “every night.”
b The blue line represents respondents who did not report difficulty initiating sleep (i.e., reported “never,” “rarely,” or “some nights”). In the case of concurrent difficulties, the blue line represents the respondents who reported both sleep difficulties “never,” “rarely,” or “some nights.”
c Respondents who screened positive for dementia at baseline were removed.
d The curves represent covariate-adjusted analyses (i.e., age, sex, marital status, education, chronic conditions, and dementia).