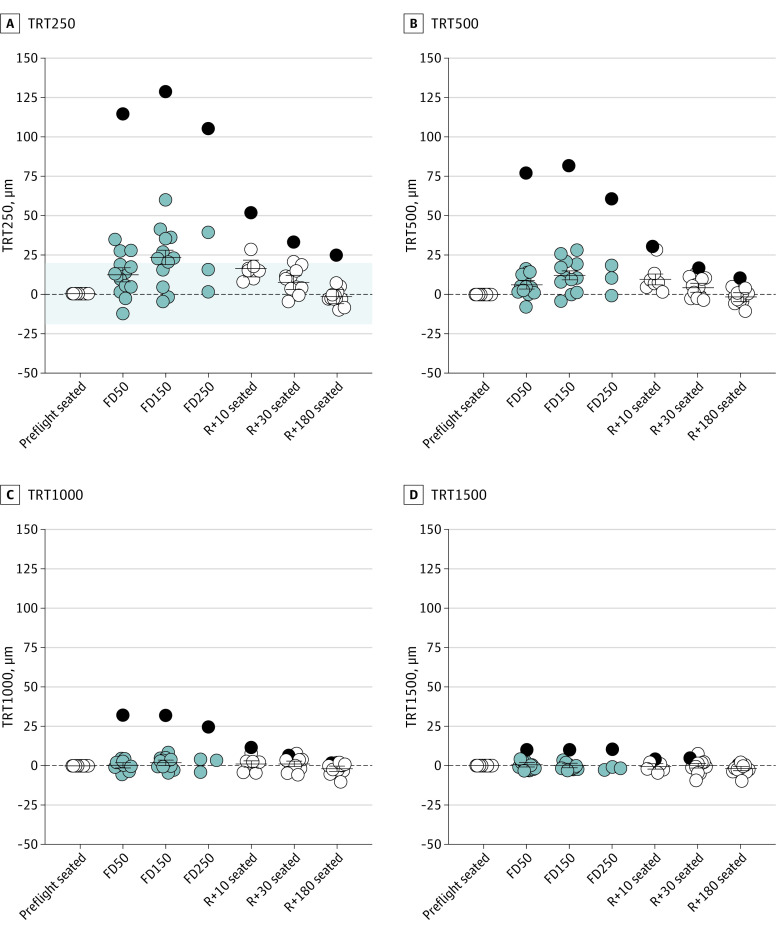
Figure 3. Changes in Peripapillary Total Retinal Thickness (TRT) During Spaceflight .
TRT250 (A) and TRT500 (B) increased on flight day (FD) 50 and FD150 and did not return to preflight baseline values until return to Earth (R) + 180. C, TRT1000 was only significantly increased on FD150 and was slightly reduced relative to the preflight seated baseline on R + 180. D, TRT1500 did not increase during spaceflight and was also slightly reduced relative to baseline on R + 180. Circles show all individual subject data representing data obtained on Earth (white), data obtained during spaceflight (light gray), and the participant with Frisén grade 1 disc edema (dark gray). Horizontal bars represent the estimated marginal mean values across participants, and error bars represent the 95% CIs. The shaded area in panel A represents the predefined range of normal day-to-day variation in TRT250 (±19.4) μm.17 P values for the change relative to the preflight seated baseline value are provided in eTable 1 in the Supplement. Statistics were not performed on FD250 data owing to the small sample size (n = 4). TRT250 indicates TRT from BMO to 250 μm; TRT500, TRT from 250 to 500 μm; TRT1000, TRT from 500 to 1000 μm; TRT1500, TRT from 1000 to 1500 μm.

