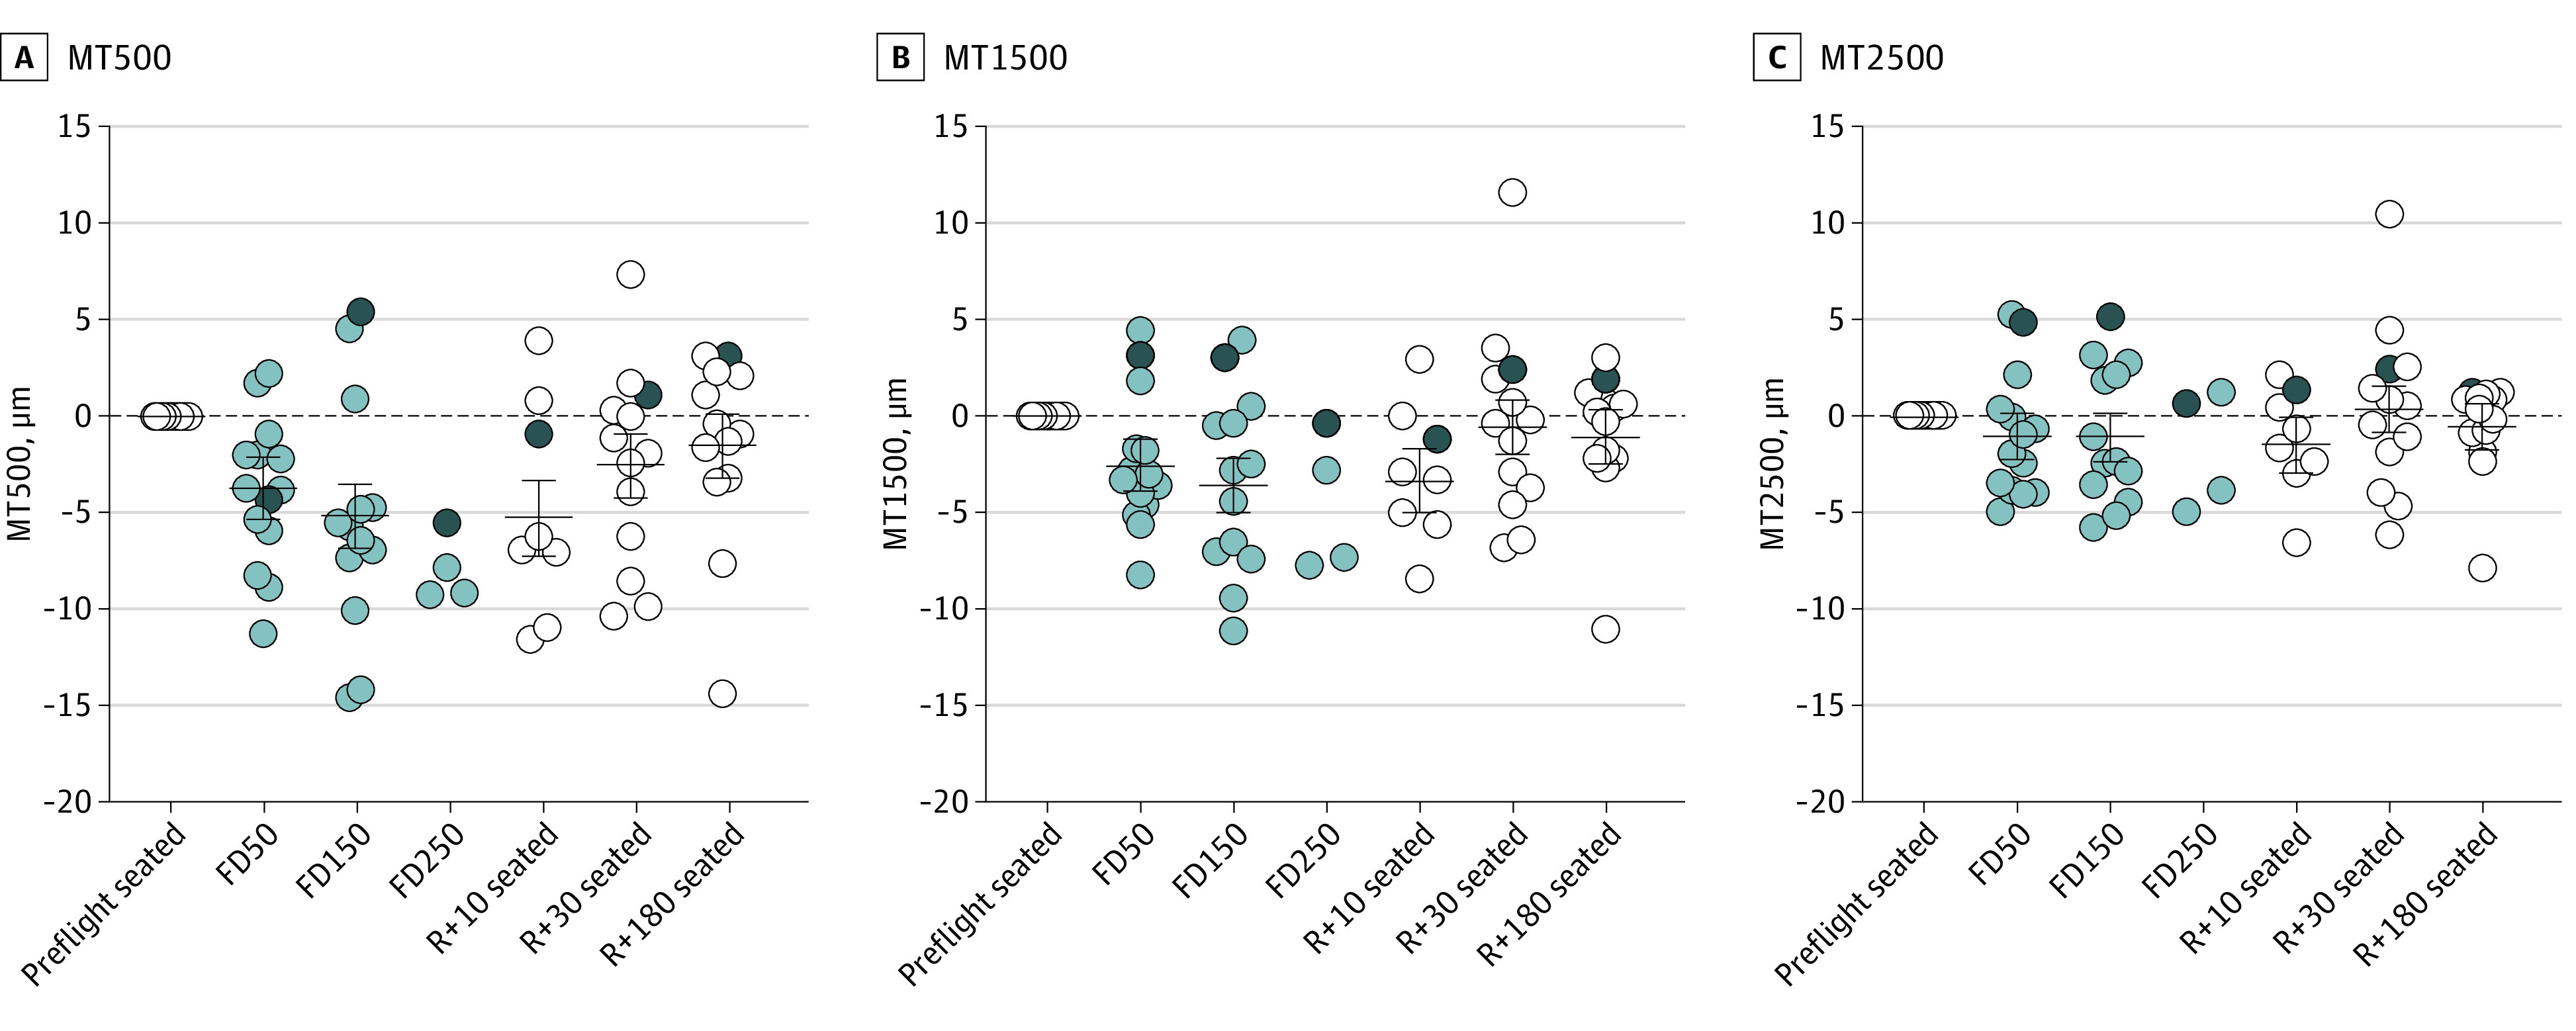
Figure 4. Changes in Macular Thickness During Spaceflight.

A, Macular thickness (MT) 500 μm decreased on flight day (FD) 50 and FD150, and it did not return to preflight baseline values until return to Earth (R) + 180. B, MT1500 also decreased on FD50 and FD150 but returned to baseline by R + 30. C, There were no significant changes in MT2500 during or after spaceflight. Circles show all individual subject data representing data obtained on Earth (white), data obtained during spaceflight (light gray), and the participant with Frisén grade 1 disc edema (dark gray). Horizontal bars represent the estimated marginal mean values across participants, and error bars represent the 95% CI. P values for the change relative to the preflight seated baseline value are provided in eTable 1 in the Supplement. Statistics were not performed on FD250 data owing to the small sample size (n = 4). MT500 indicates MT from the fovea to 500 μm; MT1500, MT from 500 to 1500 μm; MT2500, MT from 1500 to 2500 μm.
