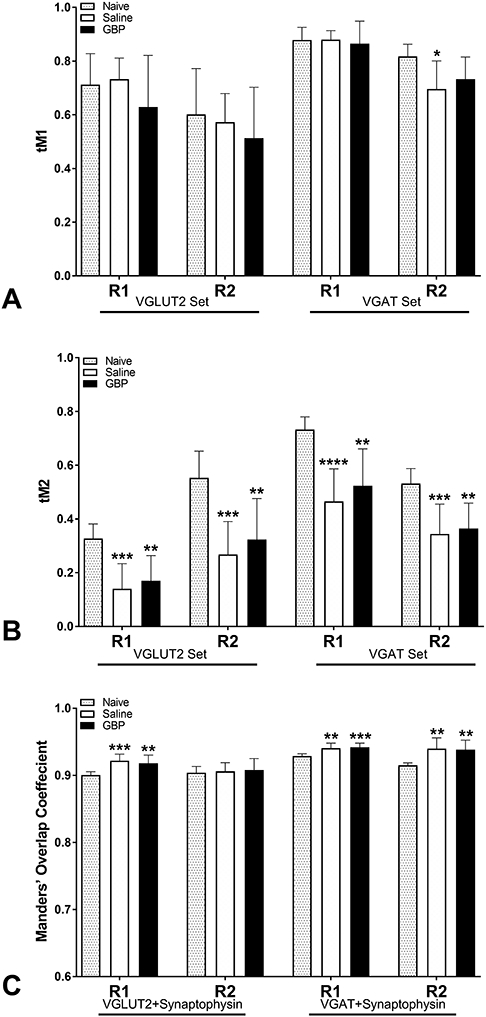
Figure 10. Quantitative co-localization analyses of synaptic immunostaining.

(A,B) The Manders’ fractional overlap coefficients, tM1 and tM2, and Manders’ overall overlap coefficient (MOC; C) were calculated to assess the co-localization of VGLUT2/Synaptophysin and VGAT/Synaptophysin staining in the same regions of interest (R1 and R2) used for density measurements. (A) The fraction of total VGLUT2 or VGAT signal overlapping with Synaptophysin (tM1) was largely unaffected by injury or GBP treatment. (B) Conversely, injury significantly decreased the fraction of Synaptophysin signal overlapping with VGLUT2 or VGAT (tM2). (C) MOC was greater than 0.9 in all groups and significantly increased after injury, with no effect of GBP treatment. N=8 naïve, N=11 Saline, N=10 GBP. *p<0.05; **p<0.01; ***p<0.001; ****p<0.001 vs naive control. Bars are mean ± SD.
