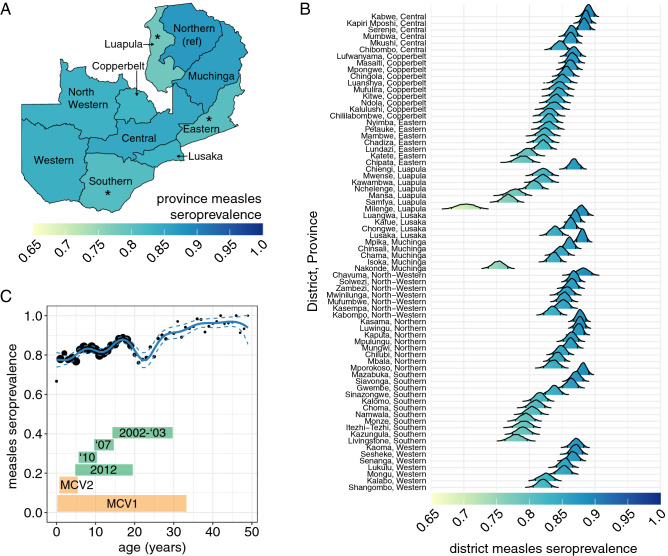
Figure 1.
Measles seroprevalence. (A) Province seroprevalence. The asterisks represent provinces that had significantly different seroprevalence than the reference province, Northern Province (0.05 alpha level). (B) District seroprevalence. The distribution of district-specific seroprevalence estimates based on a hierarchical spatial model. The left and right vertical lines within each distribution represent the 5th and 95th percentiles. (C) National age-specific seroprevalence. The points represent the data grouped by age in years with the exception of year 0 which includes only individuals 10 and 11 months old and the size of the point is proportional to the number of observations in each age group (seroprevalence estimates for individuals younger than 10 months were collected and are show in Fig. S8). The blue lines represent fitted generalized additive model mean (solid line) and 95% confidence intervals (dashed lines). The age cohorts eligible for vaccination campaigns by campaign year (green boxes) and routine doses of measles-containing vaccine dose 1 (MCV1) and dose 2 (MCV2) (orange boxes) are shown.

