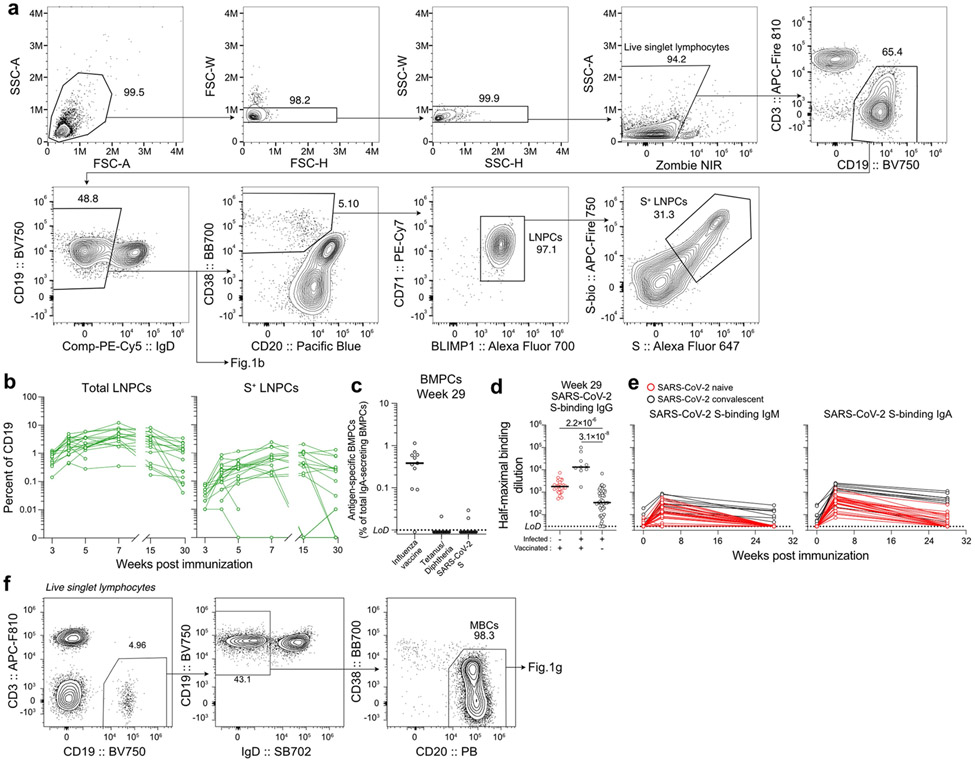
Extended data Fig. 1 ∣. Persistence of humoral immune responses to SARS-CoV-2 mRNA vaccination.
a, Flow cytometry gating strategies for GC B cells (Fig. 1b) and LNPCs (defined as CD19+ CD3− IgDlow CD20low CD38+ BLIMP1+ CD71+ live singlet lymphocytes) in the lymph node. b, Kinetics of total (left) and S-specific LNPCs (right) as gated in a. c, Frequencies of BMPCs secreting IgA antibodies specific for the indicated antigens 29 weeks after immunization. Symbols represent one sample in b (n=15) and c (n=11). d, e, Plasma antibody titers against SARS-CoV-2 S measured by ELISA in participants without (red, n=29) and with (black, n=9) a history of SARS-CoV-2 infection in SARS-CoV-2 vaccinated (left, center) and unvaccinated (right, n=48) participants 29 weeks after the first vaccine dose or symptom onset (d) and in vaccinated participants (red, n=29; black, n=9) over time (e). P values were determined by Kruskal-Wallis test followed by Dunn’s multiple comparison test between unvaccinated and both vaccinated groups (d), and by two-sided Mann-Whitney test (e). Horizontal lines indicate median values and dotted lines indicate detection limit in c and e. f, Flow cytometry gating strategies for MBCs (CD19+ cd3− IgDlow CD20+ CD38− live singlet lymphocytes) and S-binding MBCs (Fig. 1g) in blood.

