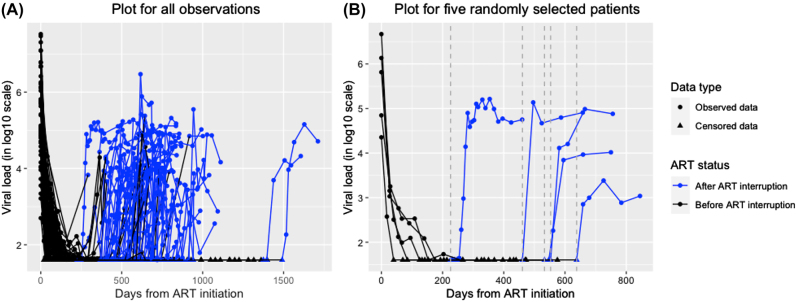
Figure 1:
Viral load (log10-scale) trajectories before and following ART interruption. Left censored values are denoted by triangle dots on the bottom horizontal line with the censored values imputed by the detection limit. Observed values are denoted by circle dots. Data during ART are in black, and data following ART interruption are in blue. The dashed vertical lines in gray indicate times when the ART was interrupted. Figure (A) shows data from all subjects, and Figure (B) shows data from 5 randomly selected subjects.

