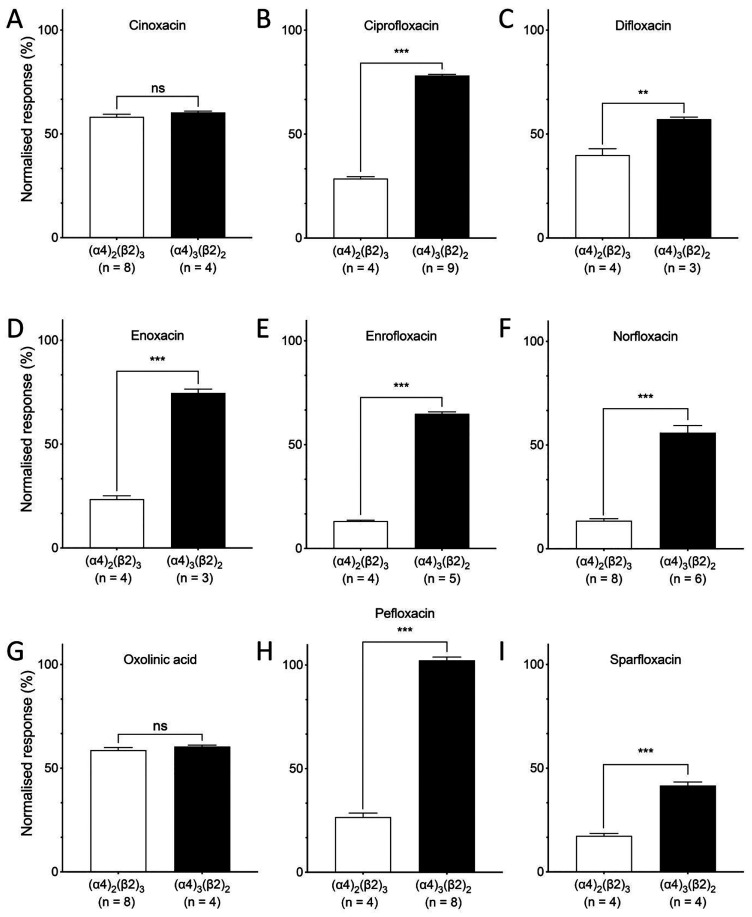
Figure 2.
Inhibitory effects of quinolone antibiotics on α4β2 nAChRs: bar charts illustrating the effects of quinolone antibiotics on (α4)2(β2)3 nAChRs (white bars) and (α4)3(β2)2 nAChRs (black bars) expressed in Xenopus oocytes. Antibiotics (100 μM) were preapplied for 30 s and then coapplied with agonist (an EC50 concentration of ACh) for 5 s or until a plateau in the response. Responses are normalized to responses to ACh in the absence of antibiotic. Data are the mean ± SEM from at least three individual experiments (as indicated). Significant differences are indicated (∗∗ = P < 0.01, ∗∗∗ = P < 0.001, ns = not significant).

