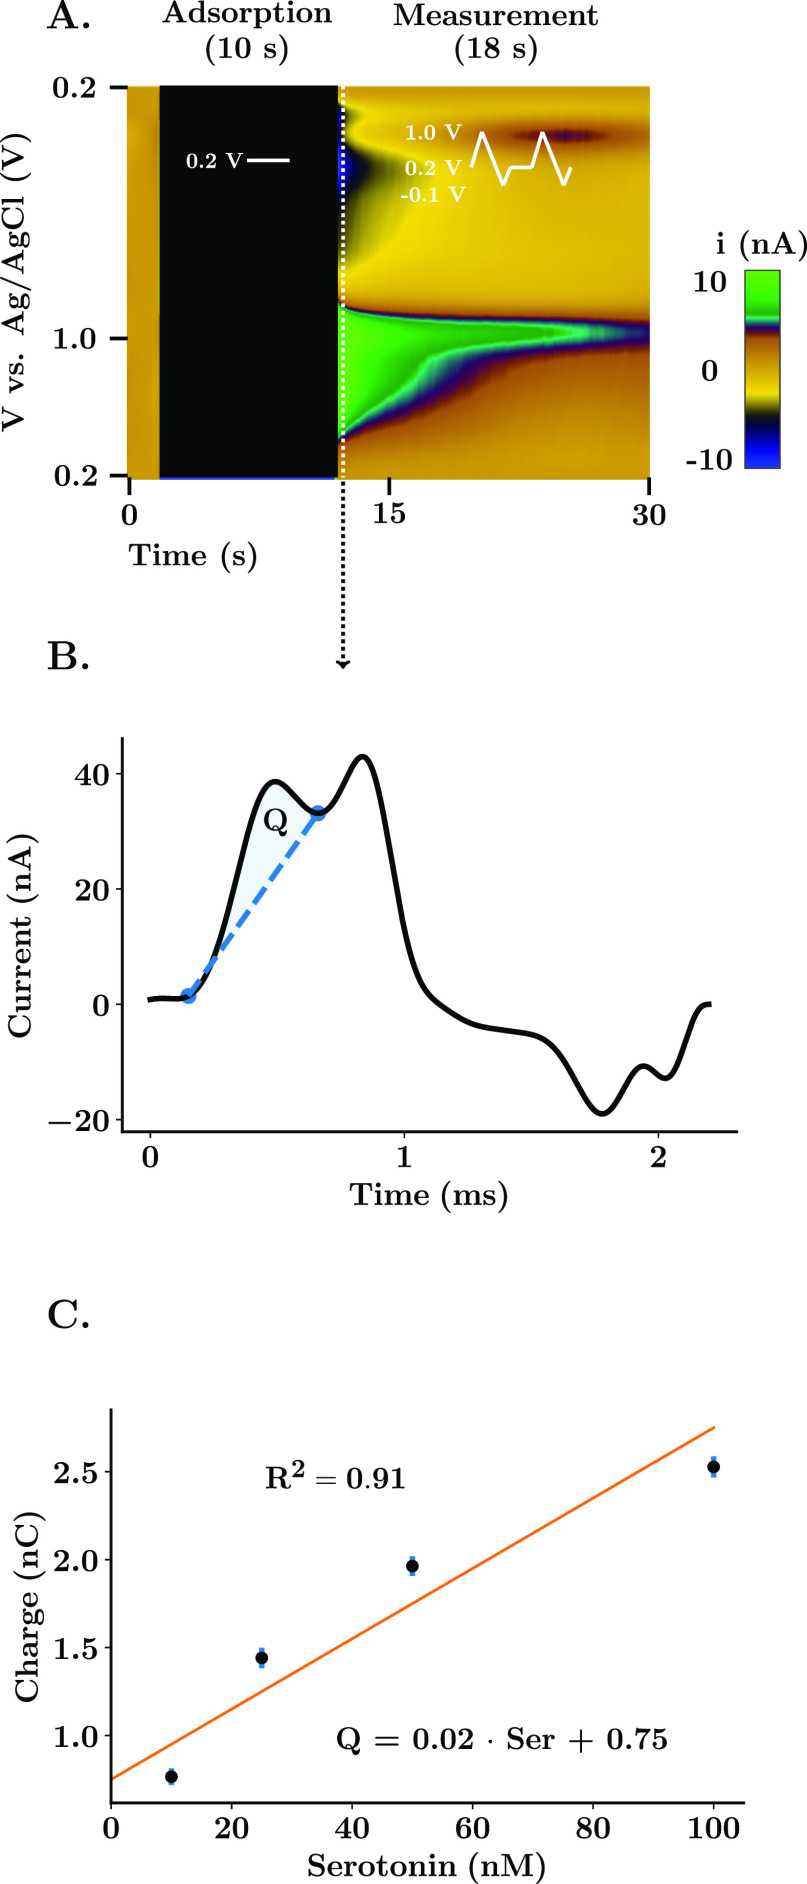
Figure 1.
Experimental and calibration strategy for FSCAV. (A) Representative color plot of a FSCAV serotonin acquisition in the CA2 region of the hippocampus. The procedure is composed of three steps: an initial 2 s where the waveform is applied (100 Hz) to minimize adsorption, followed by 10 s of holding potential (0.2 V) and finished with 18 s of conventional cycling to acquire the signal of interest. (B) Third cyclic voltammogram following the application of the voltage waveform. The Faradaic charge (Q) is the result of the integration between the serotonin peak and a baseline between integration points that minimizes the interference of the capacitive peak present at 1.0 V. (C) In vitro post-calibration curve. A linear regression is used to obtain a relationship between the integrated charge and the concentration of serotonin in solution. Scatter points and error bars show the mean ± standard deviation of 15 repetitions per concentration. R2 indicates the goodness of fit.

