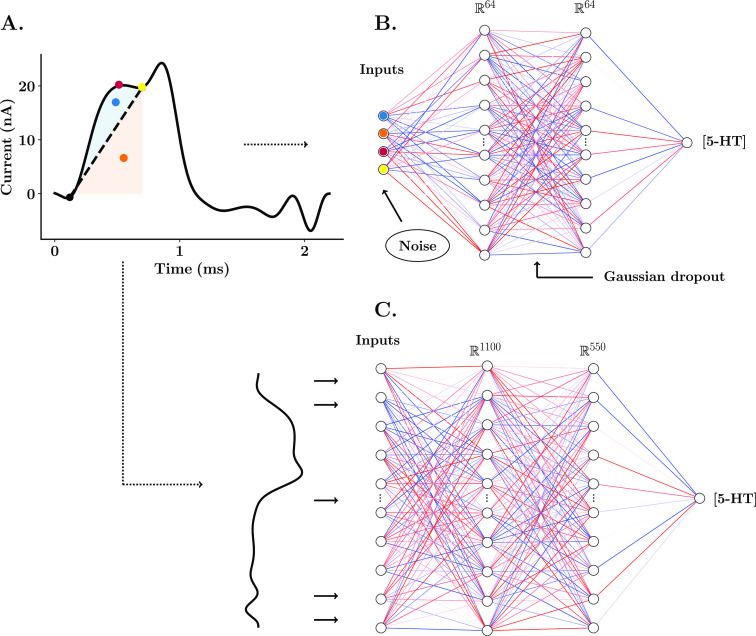
Figure 2.
Schematic of ANNs for the training and estimation of tonic concentration of serotonin. (A) FSCAV serotonin CV from an in vivo acquisition in the CA2 region of the hippocampus of a mouse. Each of the features used as inputs of the single electrode NN model are color-marked: the maximum amplitude of the Faradaic peak (red), charge above baseline (blue), baseline charge (orange), and valley point between the Faradaic peak and capacitive peak (yellow). (B) Structure of the shallow neural network for predictions from a single electrode post-calibration. (C) Structure of the shallow neural network for standardized predictions across electrodes.34

