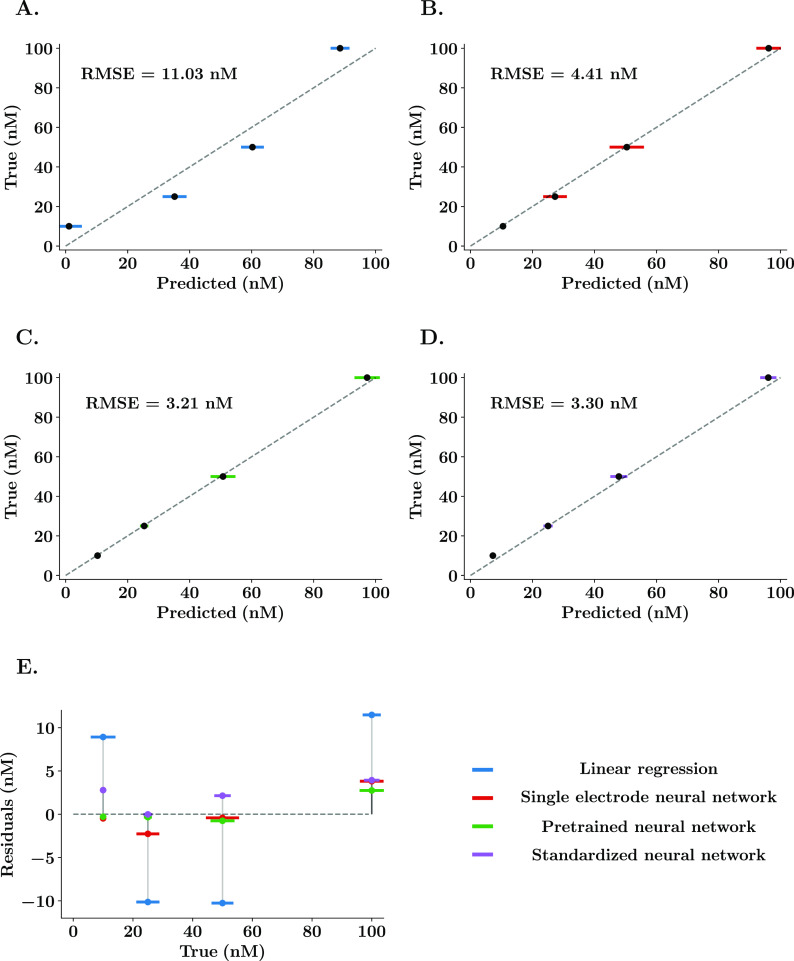
Figure 3.
Representative comparisons between linear regression and neural network predictions of serotonin in vitro. (A–D) True vs predicted values of a representative serotonin post-calibration using the model determined by the color. Error bars (colored) denote the standard deviation of 15 repetitions for each solution concentration. The gray dashed line represents the ideal predictions. (E) Residuals vs true values for both linear and neural network regressions. The neural network without pretraining (red) was trained for a limit of 300 epochs and a learning rate of 0.001. Pretraining (green) consisted of training the neural network with 140 normalized post-calibrations from different electrodes. After that, the model is finely tuned with the electrode-specific post-calibration. The standardized neural network (purple) was trained with the whole data set and using all the data points of the CVs as input features.

