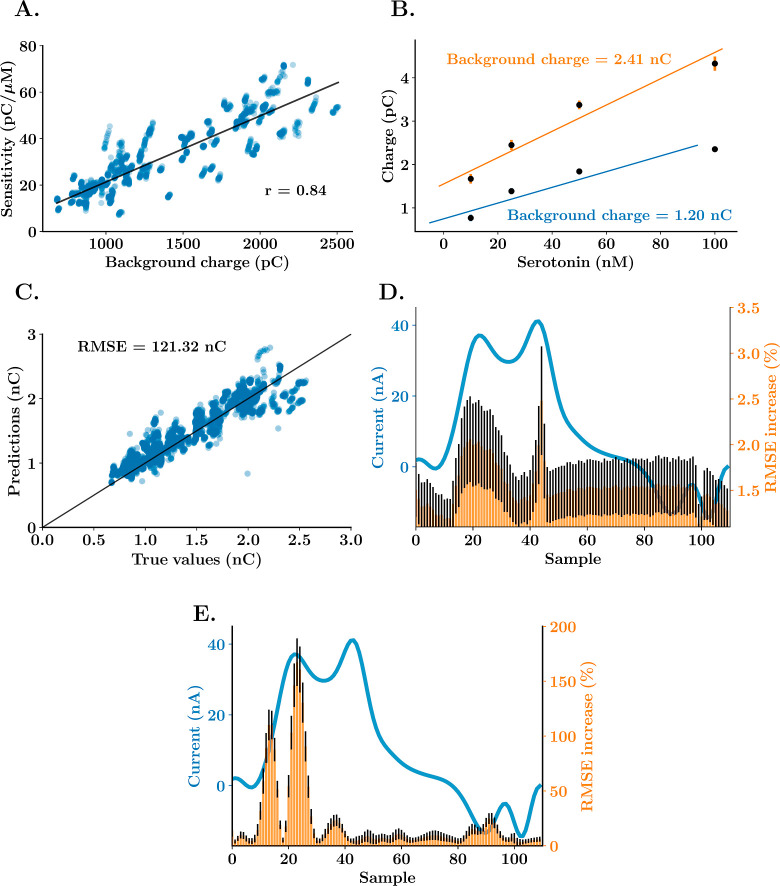
Figure 4.
Background charge correlation to FSCAV sensitivity for the detection of serotonin. (A) Sensitivity vs average background charge scatter graph for 106 electrodes, Pearson’s correlation coefficient between both parameters and best fit regression line (black). (B) Linear regression calibrations (regression line and average ± standard deviation) and average background current charges for two representative electrodes from the data set in part (A). (C) True vs predicted values of background current from the test data set (20% of the whole data set) for the last k-fold of the neural network training. The vertical line shows the ideal response, where true values are equal to predicted values. (D, E) Representative example of a CV of 100 nM serotonin solution (blue) and mean ± SEM percentage of increase of RMSE (n = 10 trainings, 100 repetitions per training) after each of the time samples in the CVs are replaced with a standardized random value across the whole data set for the ANN that predicts background current (part D) and serotonin concentration (part E). Values of average and standard deviation are shown in groups of 10 samples.

