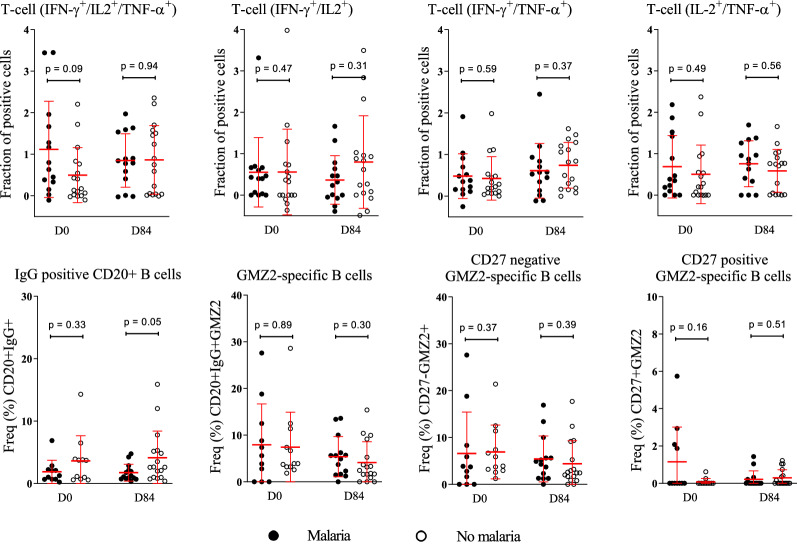
Fig. 4.
Association between T and B phenotypes with the trial outcome. Dot plot graphs show the relation between pre- and post-immunization GMZ2-specific immune phenotypes regarding presence/absence clinical malaria status after CHMI. Any parasitaemia with symptoms or parasitaemia above 1000 parasites per µl was defined as malaria (black spots), whereas any parasitaemia below the threshold of 1000 parasites / µl with no symptoms (Control) as well as individuals with neither parasitaemia nor symptoms (Protected) are represented by open circles. Comparison of cytokine producing CD4+ T-, CD20 + B- and the GMZ2-specific B phenotypes was performed using Mann-Whitney (T cells) or unpaired t-tests (B cells). Data are from a single experiment after several optimization tests, and individual volunteers were measured in separate experiments. Symbols represent individual samples. Red lines represent median values and interquartile range. p value lower than 0.05 is considered significant

