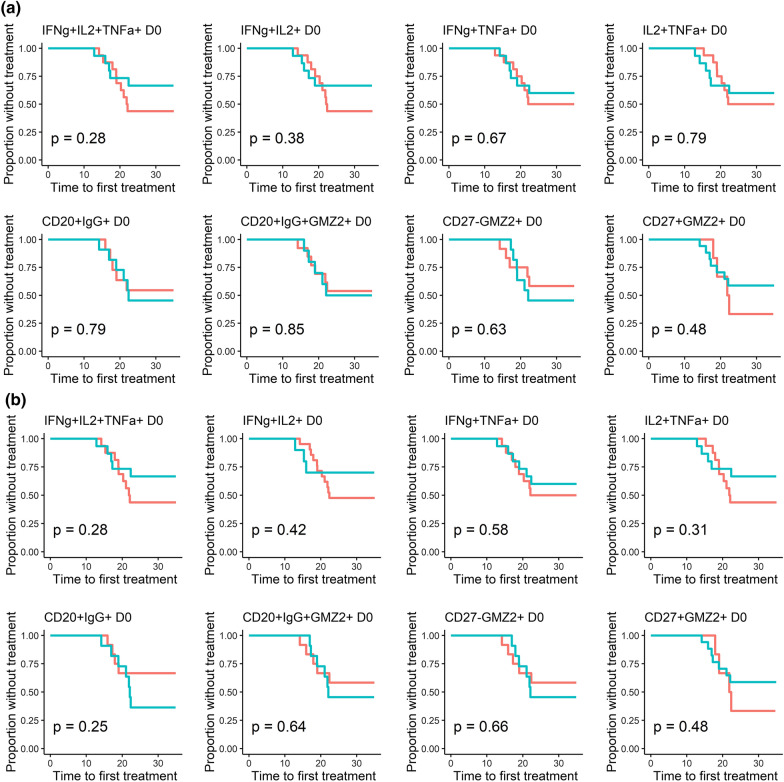
Fig. 5.
Time to treatment regarding natural acquired immunity before vaccine intervention. Graphs show the time to first malaria treatment regarding the fraction of specific triple and double positive CD4+ T, CD20+IgG+ GMZ2± and GMZ2-specific-CD27± B cells (a), or the estimated cell number for each of the same cell phenotypes (b) at baseline (D0). Values above the median are represented in red whereas data below the median are shown in blue. The Log-rank test was used to compare the two curves. P value lower than 0.05 is considered significant

