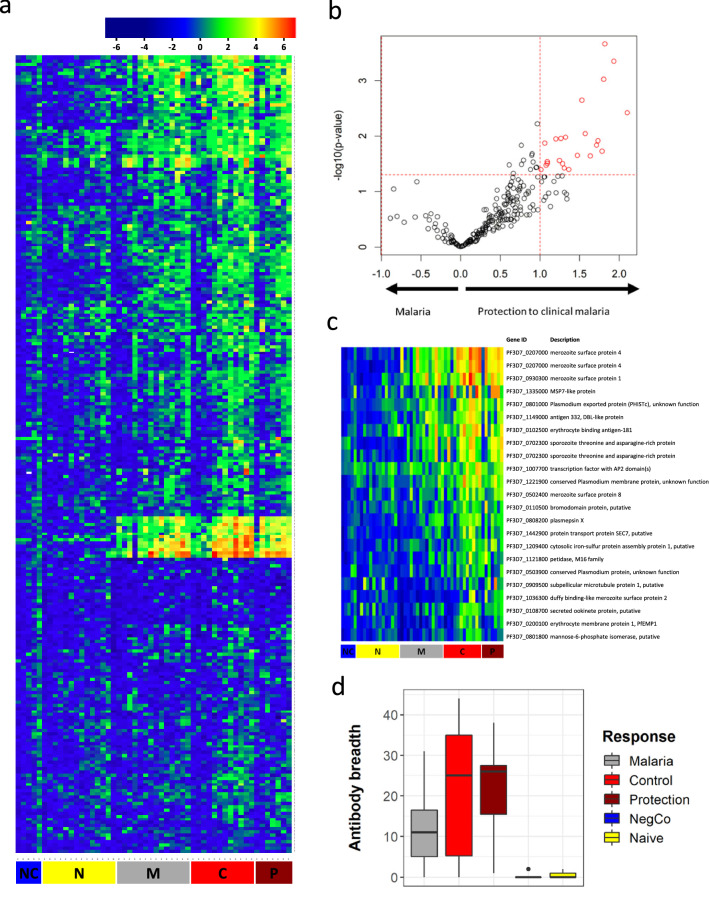
Fig. 8.
Protein microarray using plasma from volunteers undergoing CHMI. Figure shows the heatmap from protein microarrays in the semi-immune study population as well as a European malaria-naïve control population (a). The intensity of antibody responses in the population being protected from clinical malaria and those who developed malaria were compared and shown as volcano plot. The red circles are antigens being at least two-fold higher and significantly upregulated in the respective group (b). c shows the heatmap in participants having at least two-fold higher antibody response in the protected group vs. the unprotected group, thus showing the raw data of the red dots in Fig. 8b. Gene ID according to PlasmoDB are given. d shows the breadth of the antibody response in those who develop malaria (n = 15), those who control the parasitaemia (n = 12), those having full protection (n = 7), in the negative control (1 European malaria-naïve sample, measured in 5 technical replicates) and in European naïve controls (n = 13). Data are from a single experiment after several optimization tests, and individual volunteers were measured in separate experiments. Differential antibody recognition in the different allocated study outcomes was analysed by Student’s t-test. p value less than 0.05 is considered as statistically significant. NC Negative control, N malaria-naïve subjects, M subjects having clinical symptoms of malaria after CHMI, C subjects controlling parasitaemia, P subjects fully protected after CHMI

