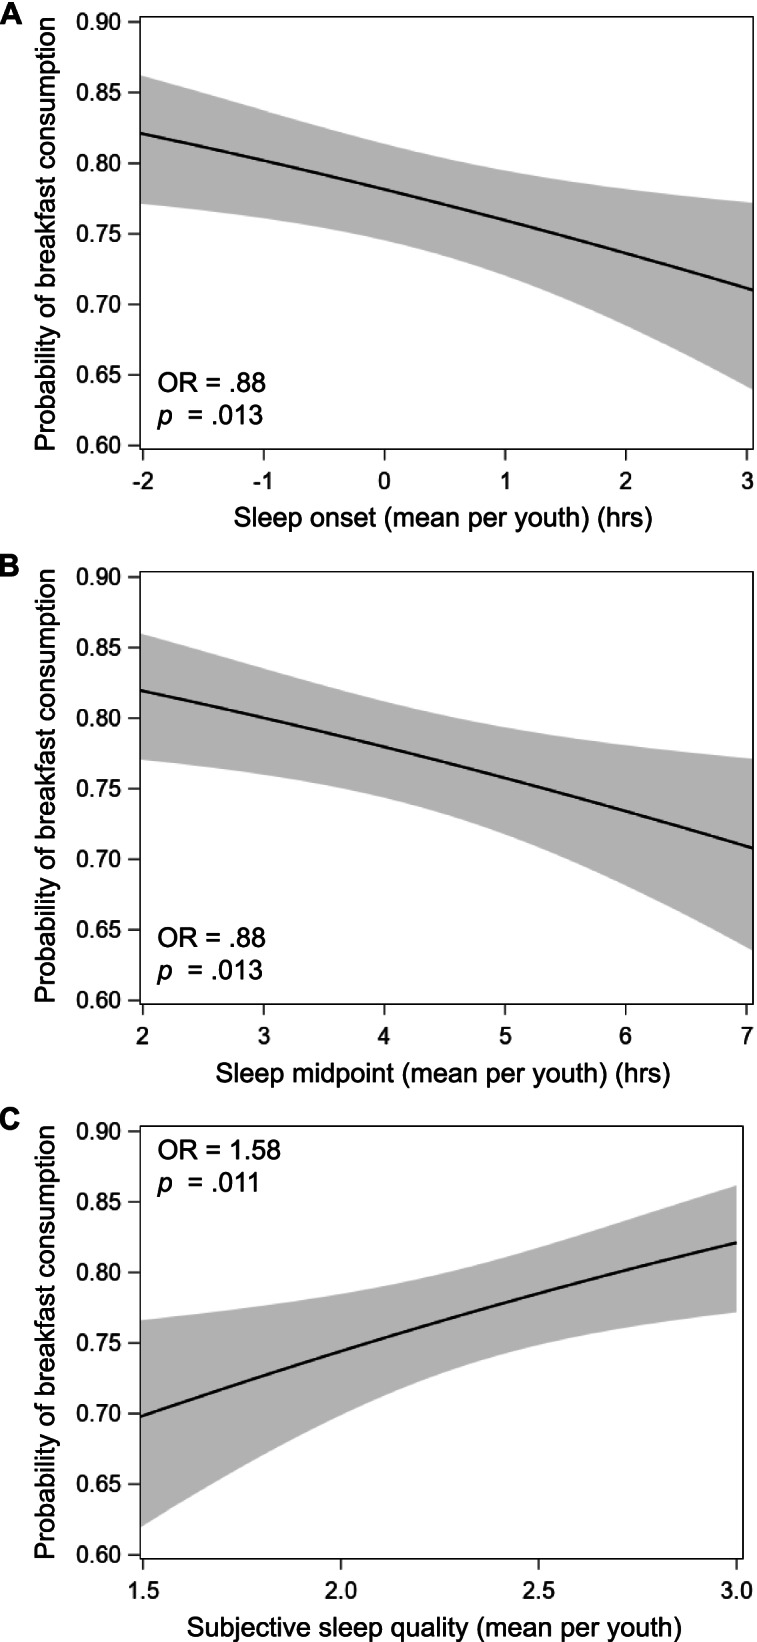
Fig. 2.

Associations of average sleep onset in hours (A), sleep midpoint in hours (B), and subjective sleep quality (C) per adolescent with average probability of breakfast consumption (between-person associations) in three separate linear mixed models. Each effect is represented by the adolescent’s mean across all time points. Sleep onset and midpoint were centered around midnight (0:00). Subjective sleep quality ranges from 0 (very bad) to 3 (very good). The mean number of valid actigraphy nights was 5.6 ± 1.4 (range: 3–9; IQR 5–7) and the mean number of breakfast reports was 5.5 ± 1.4 (range: 3–9; IQR 4–7) per adolescent. All models adjust for sleep duration (linear and quadratic, sleep duration2) and demographic/household covariates: school day, boredom, loneliness, happiness, birth sex, race/ethnicity, household income, body mass index percentile, and depressive symptoms. Shaded bands depict 95% confidence interval of probability of breakfast consumption predicted from each sleep measure
