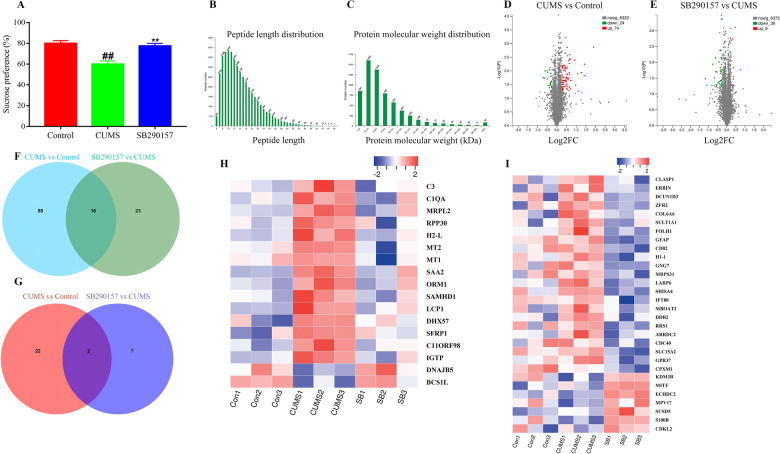
Fig. 1.
The proteomic analysis of C3aR blockade in the prefrontal cortex against depression. Sucrose preference (A). Peptide length distribution (B). Protein molecular distribution (C). Volcano plot of significant change proteins between Control and CUMS mice (D). Volcano plot of significant change proteins between CUMS and C3aR blockade mice (E). Venn diagram of significant change proteins between Control and CUMS mice (F). Venn diagram of significant change proteins between CUMS and C3aR blockade mice (G). The heat map of the significant change proteins between Control and CUMS mice (H). The heat map of the significant change proteins between CUMS and C3aR blockade mice (I). Data from Panel A were obtained from 9 mice per group. Data from Panels B–I were obtained from 3 samples (three mice per sample) per group. ##P < 0.01 versus the Control group. **P < 0.01 versus the CUMS group

