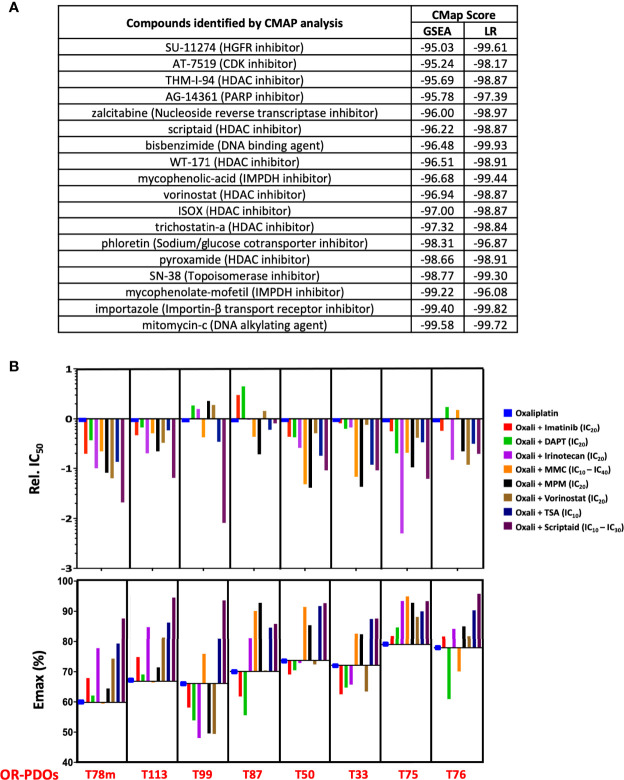
Figure 7.
Drug response signature-based combination chemotherapy. (A) Connectivity-MAP analysis identifies potential therapeutic drugs targeting OR signatures in PDO’s. Enrichment scores from searches using gene sets identified by GSEA and LOOCV/LR models are shown. (B) Response to oxaliplatin-based combination therapy in OR PDOs. Bar graphs show the IC50 and Emax of each PDO towards oxaliplatin alone or in combination with imatinib, DAPT, irinotecan, mitomycin-C, mycophenolate mofetil, vorinostat, trichostatin-A, or Scriptaid at designated dosage. IC50 is shown in relation to the IC50 of oxaliplatin alone. For MMC and scriptaid, IC10 was used for PDOs which were particularly sensitive to the drugs, and IC30 or IC40 were used for the PDOs less sensitive to the drugs.

