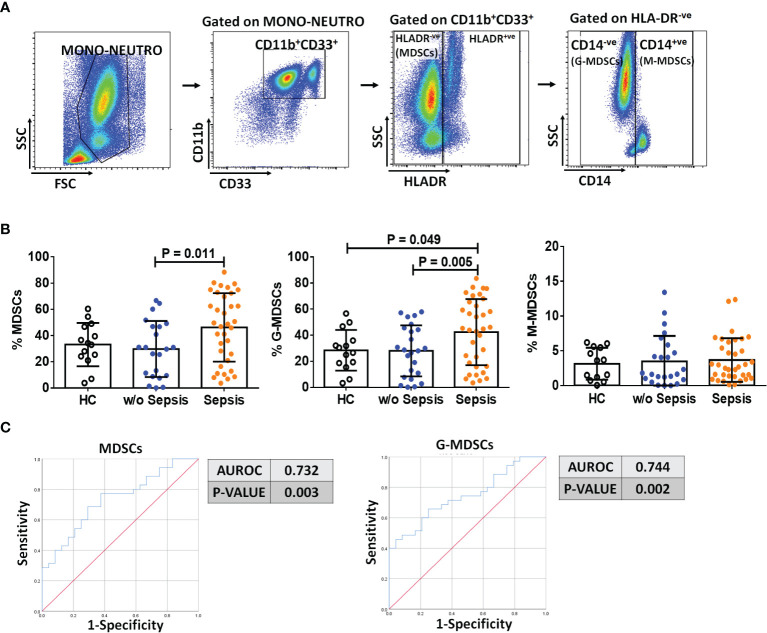
Figure 1.
Identification of MDSCs in patient groups. (A) Sequential gating strategy for identification of MDSCs and their subsets using flow cytometry. MDSCs are characterized as CD11b+CD33+HLADR−ve. (B) Scatter dot plot shows %frequency of MDSCs, G-MDSCs, and M-MDSCs. (C) ROC curve shows high specificity and sensitivity of MDSCs and G-MDSCs in sepsis patients compared to w/o sepsis patients. Results are expressed as the mean ± SD. (B) One-way ANOVA/Kruskal–Wallis test followed by probability adjustment by the Mann–Whitney. (C) ROC curve via SPSS. MDSCs, myeloid-derived suppressor cells; ROC, receiver operating characteristic.

