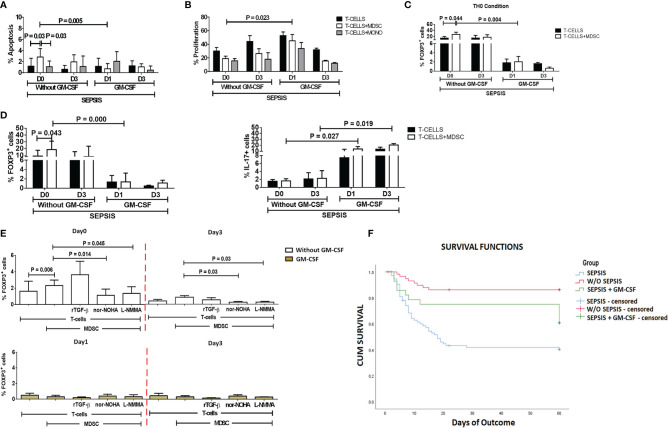
Figure 5.
Effect of GM-CSF treatment on T-cell functionality and Treg expression. Bar diagrams show (A) %Apoptosis using PI−veAnnexin V+ve and (B) %Proliferation using CFSE in sepsis patients with and without GM-CSF in T cells cultured alone (black color), with MDSCs (white color), and with monocytes (gray color). Bar diagrams show expression of %FOXP3+ on CD4+ T cells (C) under Th0 condition and (D) under Th17-proliferating condition in T cells cultured alone (black color) and with MDSCs (white color). (E) Expression of %FOXP3+ on CD4+ T cells in T cells cultured with MDSCs along with stimulations with rTGF-β, l-NMMA, and nor-NOHA; %FOXP3+ Treg expression was observed in the groups with (light brown) and without GM-CSF (white color) at different time points. Results are expressed as the mean ± SD. (A–D) Mann–Whitney/t-test within the patient groups along with one-way ANOVA/Kruskal–Wallis test between the groups. (E) Kruskal–Wallis test within the group along with the multiple comparisons. (F) Survival in patient groups was observed using the Kaplan–Meier survival curves via SPSS. GM-CSF, granulocyte-macrophage colony-stimulating factor; CFSE, carboxyfluorescein succinimidyl ester; MDSCs, myeloid-derived suppressor cells.

