
Extended Data Fig. 5.
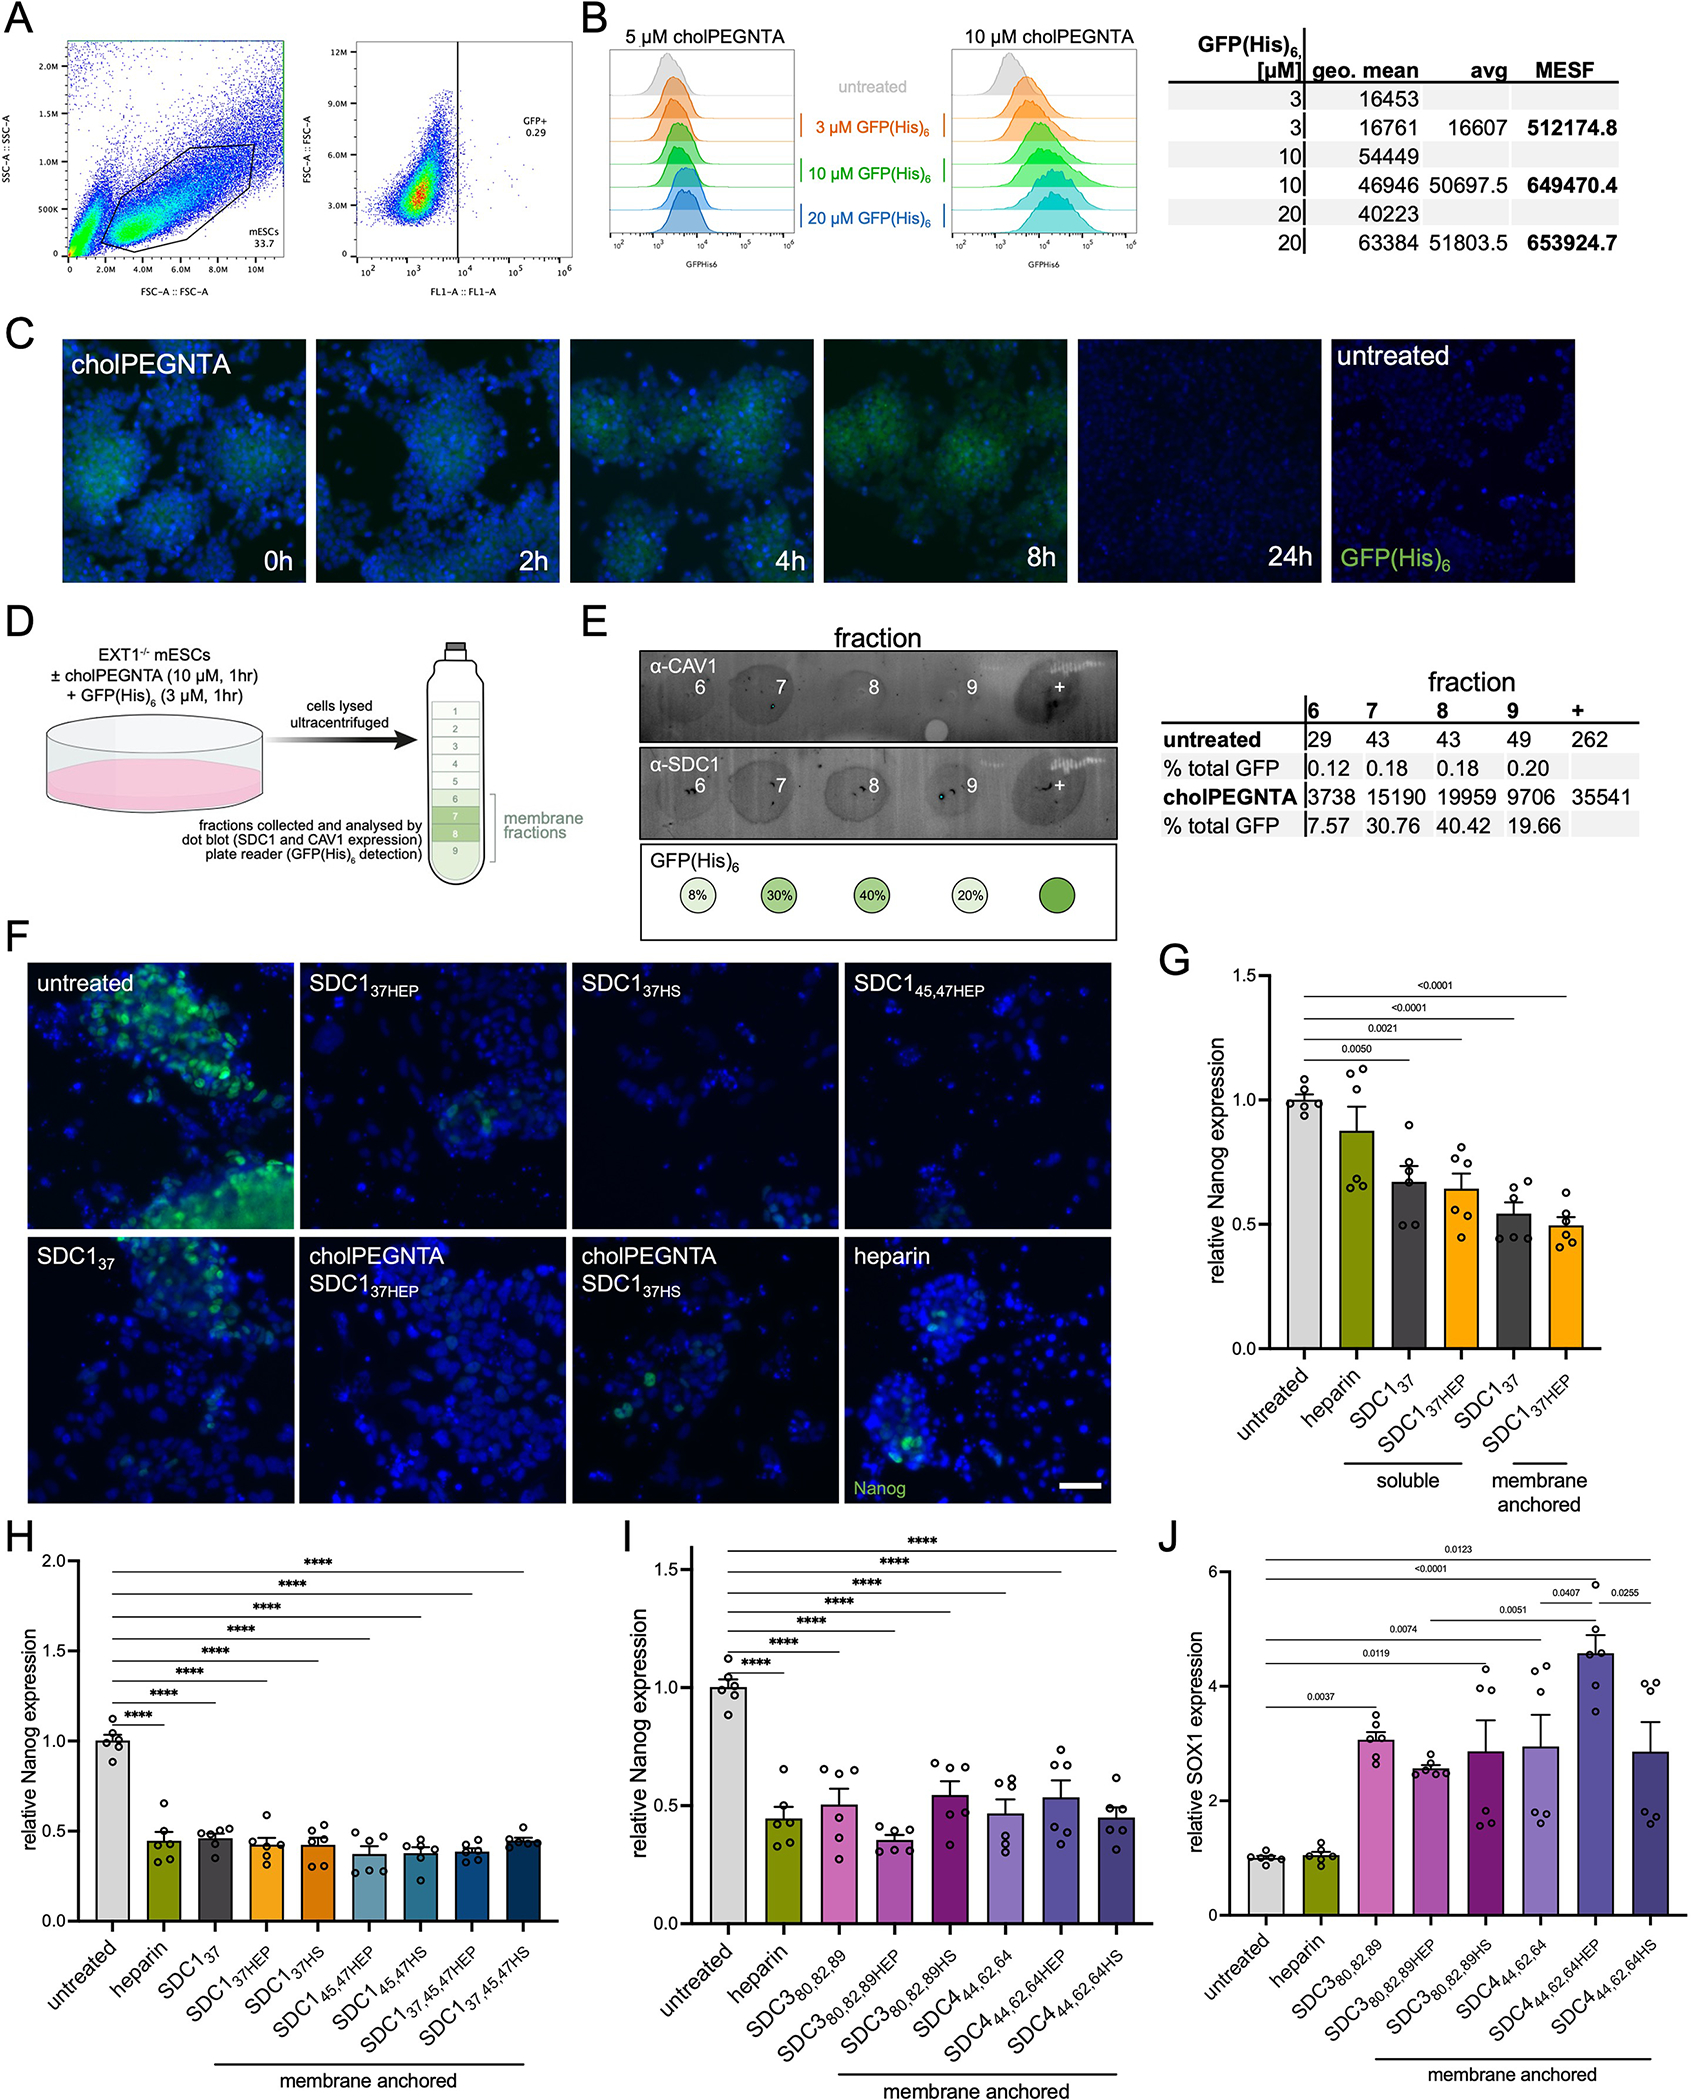
Characterization of mESC remodeling by cholPEGNTA and additional differentiation data (A) Flow cytometry gating of EXT1−/− mESCs incubated with 10 μM cholPEGNTA for single cells (left), and GFP-negative population (right). (B) Treatment of EXT1−/− mESCs with 10 μM cholPEGNTA alone (untreated), or further incubation with varying concentrations of GFP(His)6 (3, 10 and 20 μM) demonstrates dose-dependent fluorescence. Comparisons of geometric mean GFP fluorescence from cells treated with 10 μM cholPEGNTA to GFP calibration beads allows for quantification of molecules of equivalent soluble fluorochrome (MESF) of protein on each cell. Saturation is observed at 10 μM GFP(His)6 at ~650,000 MESF. (C) Representative microscopy image of EXT1−/− cells treated with 10 μM cholPEGNTA for 1 hr and fixed at the indicated time points (hours after end of cholPEGNTA treatment) with 4% PFA/PBS. Cells were incubated with 10 μM GFP(His)6 and 100 μM Ni(OAc)2 for 1 hr in PBS before Hoechst staining. NTA headgroup remains accessible to His-tagged proteins for at least 8 hr. Data representative of two biological replicates. (D) Cartoon representation of EXT1−/− mESC treatment and ultracentrifugation for isolation of lipid rafts/caveolae in membrane fractions (green). (E) Dot blots from cholPEGNTA and GFP(His)6 treated EXT1−/− mESCs demonstrates significant overlap of CAV-1 (top) and SDC1 (middle) in lipid rafts. GFP(His)6 (bottom) was detected by fluorescence plate reader and quantified as a percentage of cholPEGNTA in each fraction (right). (F) Representative fluorescence microscopy images of mESCs on D6 of neuronal differentiation. Untreated EXT1−/− cells retain high Nanog expression, indicative of a pluripotent state, whilst mESCs differentiated with SDC1 constructs or soluble heparin lose Nanog expression (green). (G) RT-qPCR analysis of differentiated cells demonstrates decreased Nanog expression compared to untreated. Cells remodeled with cholPEGNTA for cell surface display of SDC1 proteins had lesser Nanog expression. (H) RT-qPCR analysis demonstrates significantly decreased expression of pluripotency marker Nanog at D6 upon treatment with heparin or SDC1 constructs. (I) Similar results to SDC1 are observed for Nanog expression when cells are treated with SDC3 and SDC4 proteins. (J) RT-qPCR analysis at D6 shows increased SOX1 expression when cells are treated with SDC3 and SDC4 proteins, both deglycosylated and as glycoconjugates. SDC4 shows significant differences between core protein (light purple) and its azHEP conjugate (purple), and between azHEP and azHS conjugates (dark purple). All experiments performed in technical triplicate in two biological replicates. One-sided ANOVA with Tukey’s post-hoc, p values indicated on graph, (****) p <0.0001. Bar graphs represent means and error bars represent SEM.