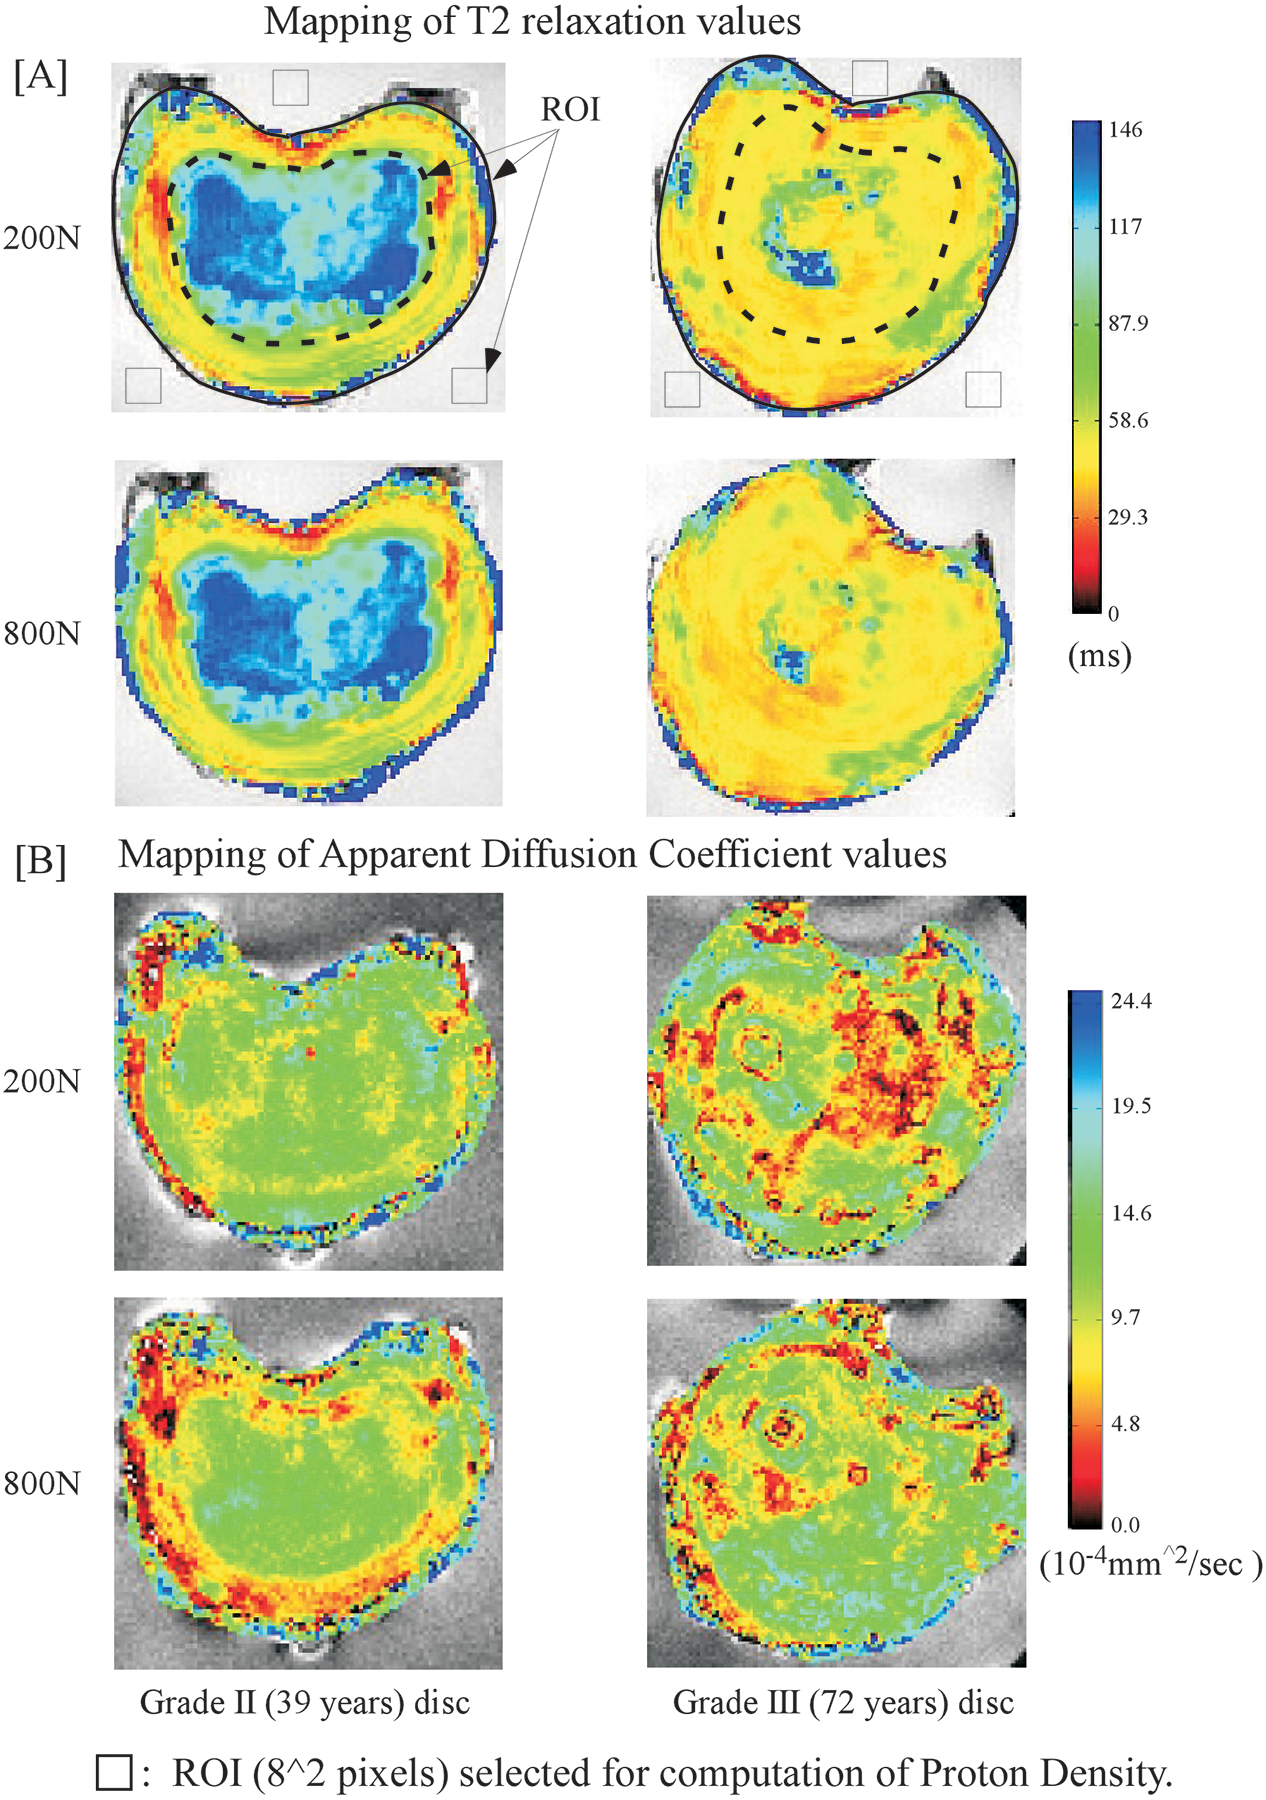
Figure 3.

Comparisons of the spatial maps obtained for T2 (A) and diffusion (B) values for the Grade II and the Grade III (72 year old) disks at 200N and in response to 800 N loading states. Segmentation templates used to obtain (8*8) pixel Region of Interests for computation of estimated hydration state within the nucleus, annulus and saline regions are illustrated.
