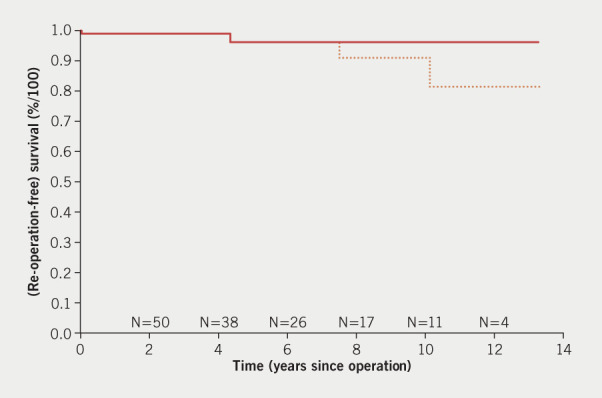
Figure 5. Kaplan-Meier analysis prepared by Professor J J M Takkenberg. Time-to-event analysis shows two deaths at 5 days and at 4.5 years and two re-operations at 6 and 9 years. The small numbers of patients ‘at risk’ with more than 2 years of follow-up affects the appearance of the chart. The single event at 9 years has a large impact on the overall analysis of survival because of the few patients operated on that long ago.