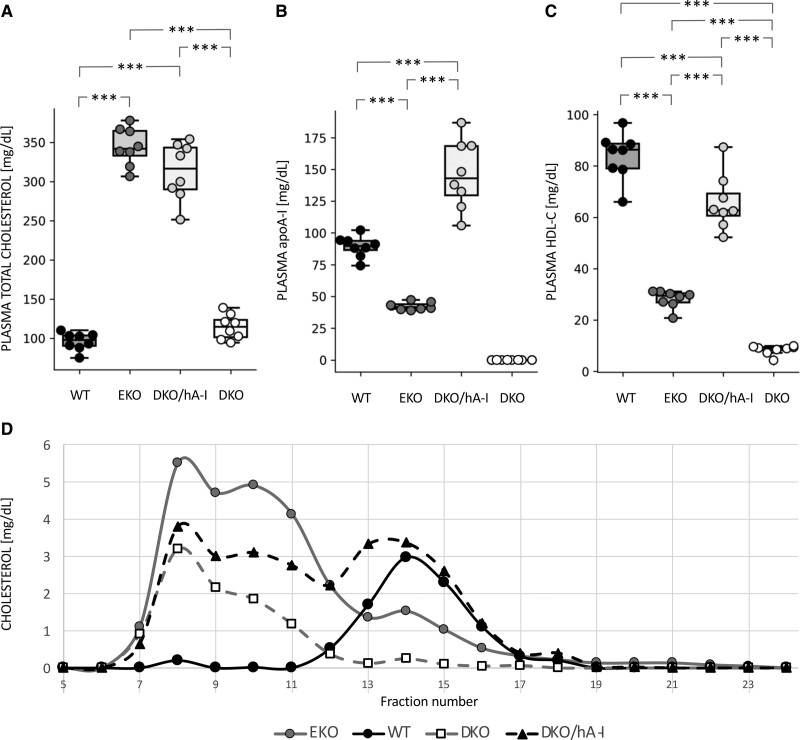
Figure 1.
Plasma cholesterol and apoA-I (apolipoprotein A-I) levels. Plasma total cholesterol (A), apoA-I (B), HDL-C (high-density lipoprotein cholesterol (C) concentrations, and cholesterol distribution among lipoproteins by fast protein liquid chromatography in the 4 genotypes (n=8). Statistically significant differences were determined by ANOVA followed by Tukey post hoc. ***P<0.001. Precise adjusted P values are shown in Table S1.

