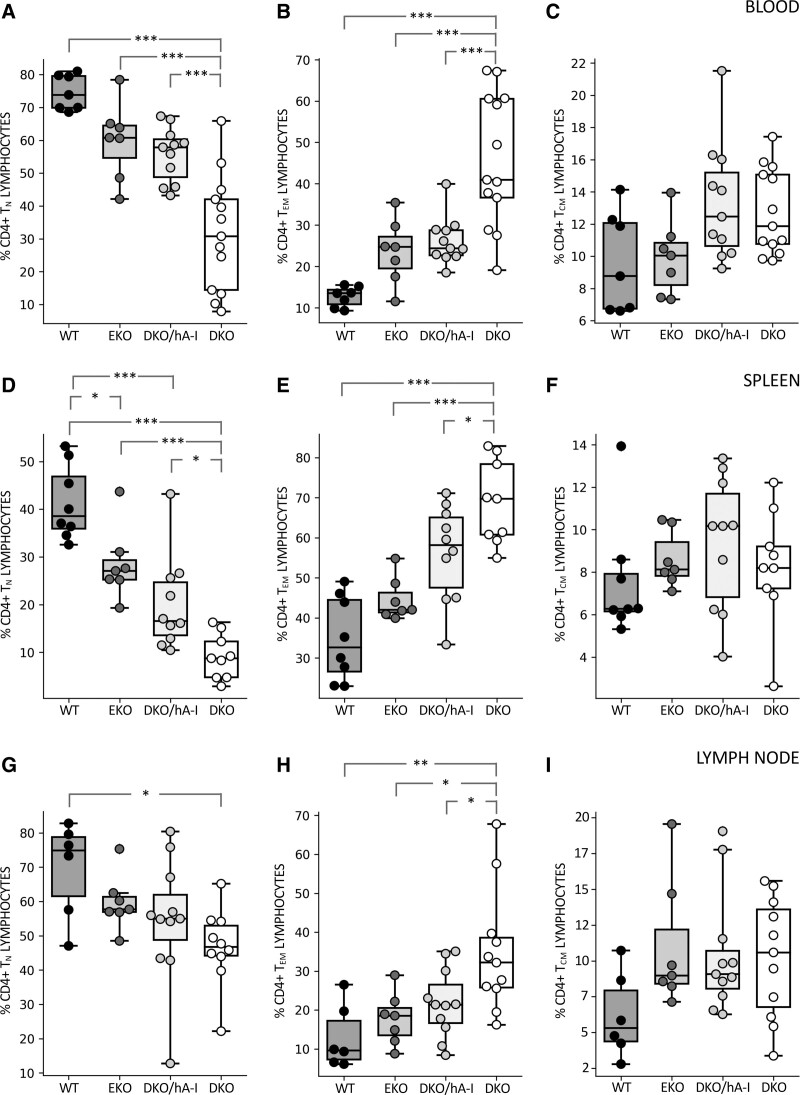
Figure 5.
CD4+ T-cell subsets in blood, spleen, and axillary lymph node. Flow cytofluorimetric evaluation of the percentage composition of CD4+ T-cell subsets is shown in blood (A–C), spleen (D–F), and axillary lymph node (G–I; n=7–13). Statistically significant differences were determined by ANOVA followed by Tukey post hoc test, except for (C) and (I) which were analyzed by Kruskal-Wallis followed by Dunn post hoc test. *P<0.05; **P<0.01; and ***P<0.001. Precise adjusted P values are shown in Table S1. DKO indicates apoE/apoA-I double deficient; DKO/hA-I, DKO mice overexpressing human apoA-I; EKO, apoE deficient; and WT, wild type.

