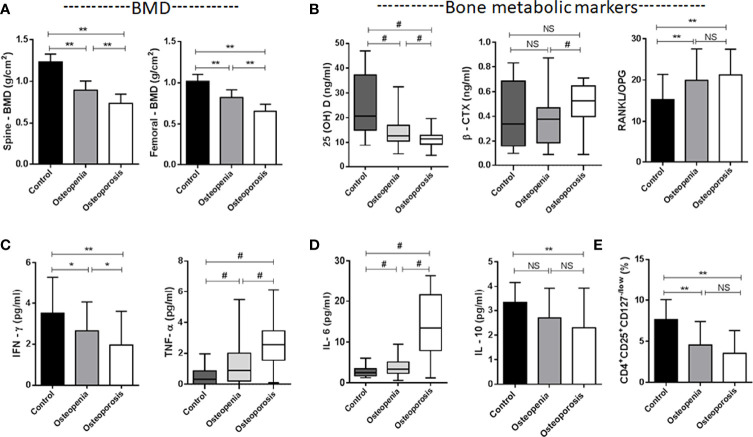
Figure 1.
Characteristics of the studied groups. (A) Spine L1-4 BMD and Femoral neck BMD. (B) Bone metabolic markers [25(OH)VD, β-CTX, RANKL/OPG]. (C) Plasma levels of TNF-α and IFN-γ secreted by Th1. (D) Plasma levels of IL-6 and IL-10 secreted by Th2. (E) CD4+CD25+CD127-/low Treg cells. *p < 0.05, **p < 0.01, # p < 0.017 (# p < 0.017, was considered significant, the test level needed to be adjusted for multiple pairwise comparisons of data, inspection level α’= inspection level α/times of comparison). NS, No statistical differences. Data are Mean± SD or Mean ± Q.

