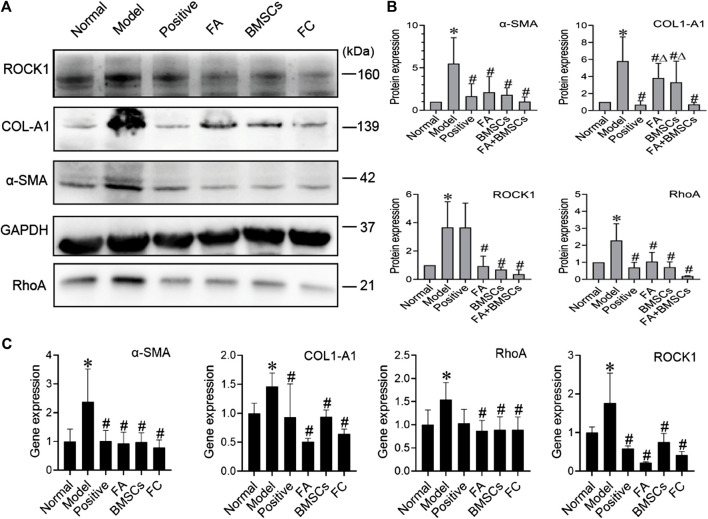
FIGURE 2.
(A,B) Western blot and cumulative densitometric analyses of ROCK1 (160 kDa), COL1-A1 (139 kDa), α-SMA (42 kDa), GAPDH (37 kDa), and RhoA (21 kDa) in livers from each group (normal, model, positive, FA, BMSCs, FC). Data are presented as the mean ± SEM (n = 3 independent experiments, Two-way ANOVA; *p < 0.05 versus the normal group; #p < 0.05, versus the model group; Δp<0.05, versus the FC group); (C) qRT-PCR analysis for α-SMA, COL1-A1, ROCK1, and RhoA in rat livers. Data are presented as the mean ± SEM (n = 3 independent experiments, Two-way ANOVA; *p < 0.05 versus the normal group; #p < 0.05 versus the model group).

