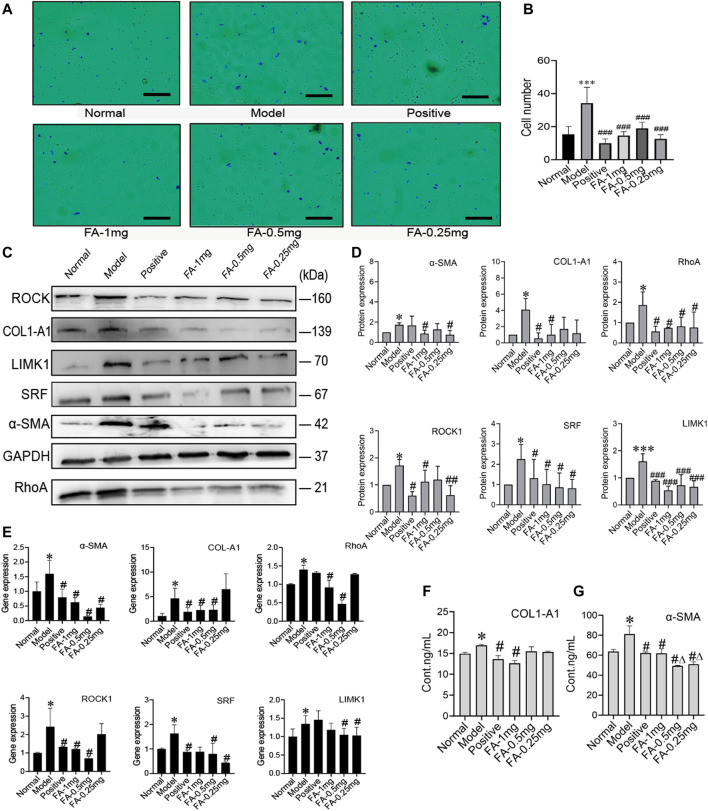
FIGURE 4.
FA promotes BMSC-mediated inhibition of the activation of HSCs. (A) Migration of HSCs (original magnification, ×10; scale bars, 100 μm). (B) The number of migrating HSCs. (n = 3 independent experiments, Two-way ANOVA; ***p < 0.001 versus the normal group; ###p < 0.001, versus the model group); (C,D) Western blot bands and cumulative densitometric analyses of each group (normal, model, positive, FA-1 mg, FA-0.5 mg, FA-0.25 mg). (n = 3 independent experiments, Two-way ANOVA; *p < 0.05, ***p < 0.001, versus the normal group; #p < 0.05, ###p < 0.001, versus the model group); (E) qRT-PCR analysis for α-SMA, COL1-A1, ROCK1, RhoA, SRF, and LIMK1 in HSCs. (n = 3 independent experiments, Two-way ANOVA; *p < 0.05 versus the normal group; #p < 0.05 versus the model group); (F,G) The protein content of α-SMA and COL1-A1 in extracellular medium. n = 3 independent experiments, Two-way ANOVA; *p < 0.05 versus the normal group; #p < 0.05 versus the model group; Δp<0.05 versus the 1 mg FA group.

