Figure 3.

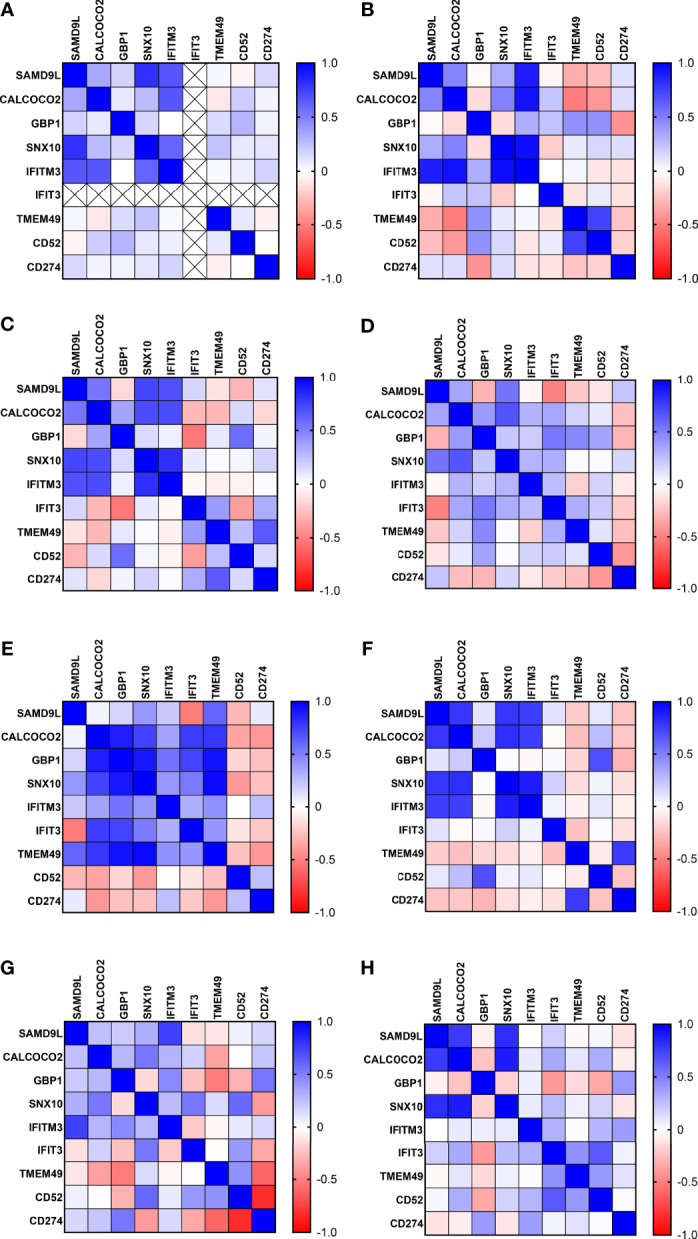
Correlation matrix analysis of protein biomarker inter-relationships in all control and TB disease groups (A) UK-CNTRL (B) P-CNTRL (C) A-CNTRL (D) LTBI non-progressors (E) LTBI progressors (F) J-EPTB (G) A-EPTB (H) PTB.

Correlation matrix analysis of protein biomarker inter-relationships in all control and TB disease groups (A) UK-CNTRL (B) P-CNTRL (C) A-CNTRL (D) LTBI non-progressors (E) LTBI progressors (F) J-EPTB (G) A-EPTB (H) PTB.