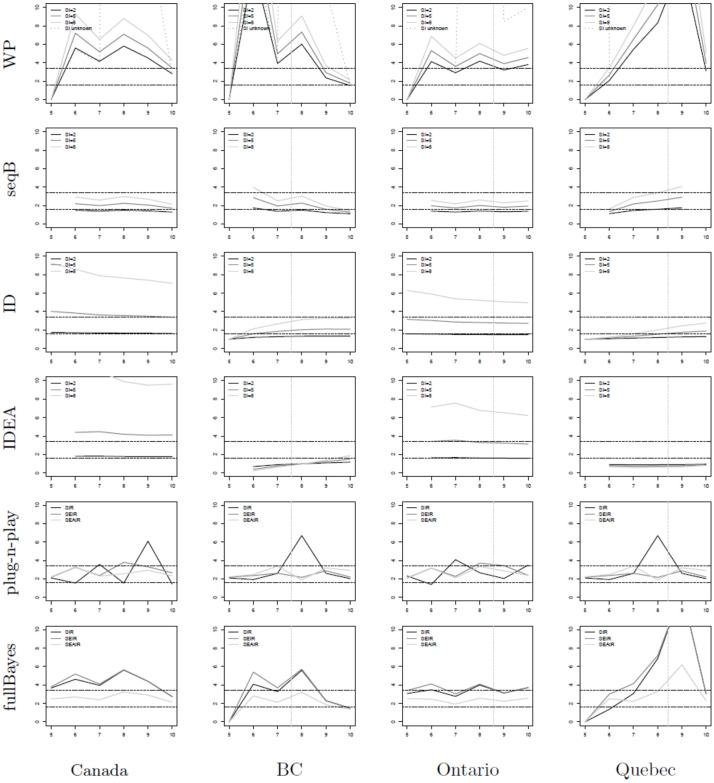
Fig 6. R0 estimators (y-axis) for COVID-19 data in Canada.
Data from [52]. The x-axis shows time in weeks where t = 0 denotes January 25, 2020—the date of the first known case in Canada [51]. The vertical gray line shows the date of lockdown for each of the provinces (there was no national lockdown date) [51]; while the horizontal lines denote estimates of R0 from reference [3]. The provinces of BC (second column), Ontario (third column), and Quebec (last column) are studied, as well as the entire nation (first column). The WP, seqB, ID and IDEA methods are applied using assumed known serial intervals of 2, 5, and 8 days.

