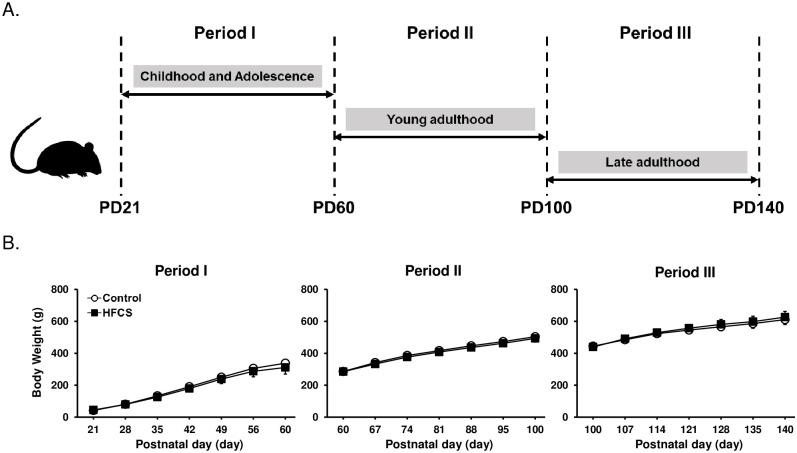
Fig 1. Body weight during each experimental period.
(A) Experimental schedule of this study. (B) No significant differences were observed in the body weight between the two groups. Period I: C and H, n = 7, Period II: C and H, n = 8, Period III: C and H, n = 7. C, Control group; H, HFCS group. Data are presented as the mean ± SD.

