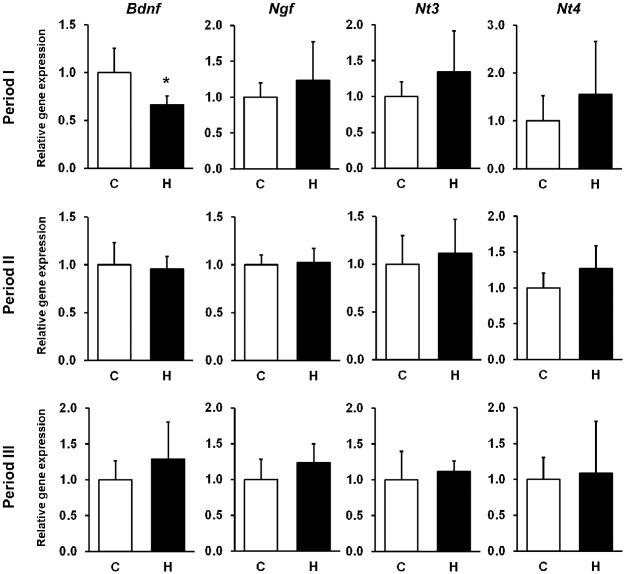
Fig 2. Hippocampal mRNA levels of NFs.
Each mRNA was quantified by qPCR. The results are expressed as the ratio of the relative intensity of levels of gene expression to Actb. Bdnf gene expression was reduced in the Period I with HFCS. Period I: C, n = 5; H, n = 6, Period II: C, n = 8; H, n = 7, Period III: C, n = 7; H, n = 6. C, Control group; H, HFCS group; data are presented as mean ± SD.*p < 0.05.

