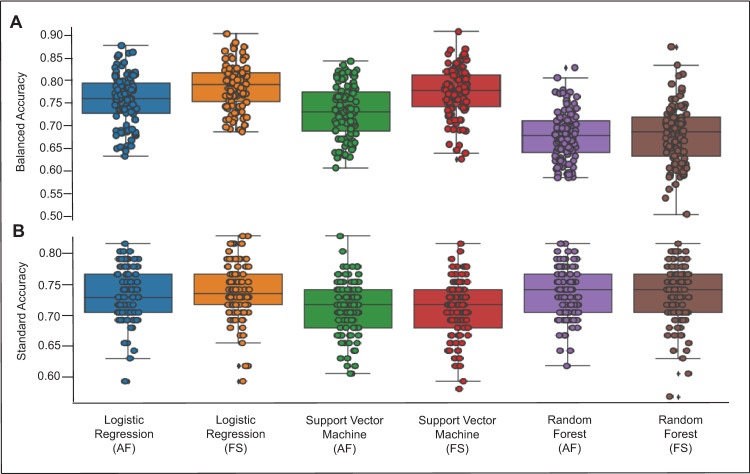
Fig 3.
Model performance for the home vs. community threshold (2500 steps/day; A- upper figure) and aerobic threshold (5500 steps/day; B- bottom figure). Model performance for each algorithm is displayed with all features included (AF) and with feature selection (FS) that occurred as a result of the regularization step. Circles represent individual accuracy results for model performance during the 100 different train-tests splits of the data. Diamonds represent outliers. A higher accuracy score reflects better model performance.

