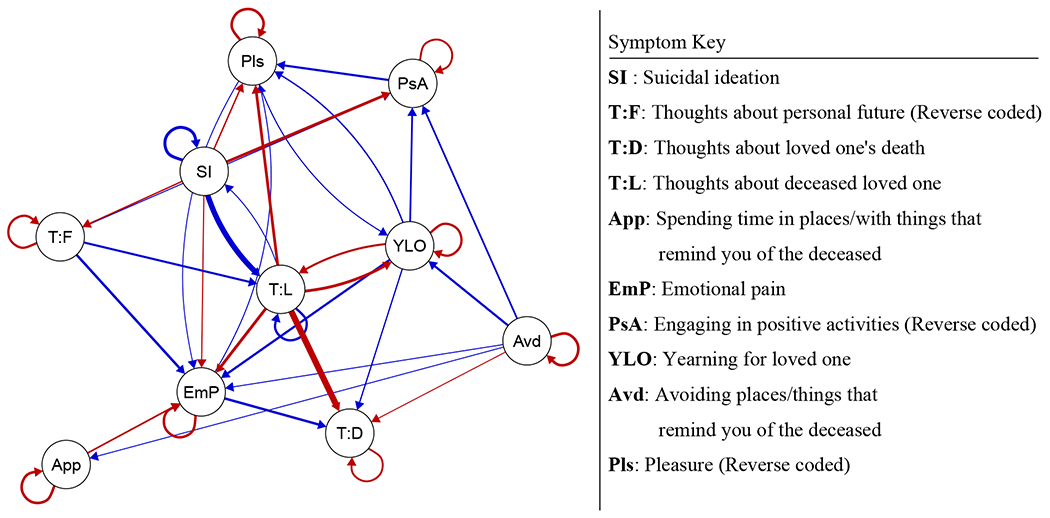
Figure 1. Symptom Dynamics of Complicated Grief.

Blue edges represent positive relations, red represents negative relations. Autoregressive effects were rescaled to improve edge contrast, and edges with absolute values below .05 were omitted from the visualization. Note that this network represents the lagged relation between the changes in symptom values (i.e., the use of an integrated VAR) rather than the lagged relations between the symptom values themselves. .
