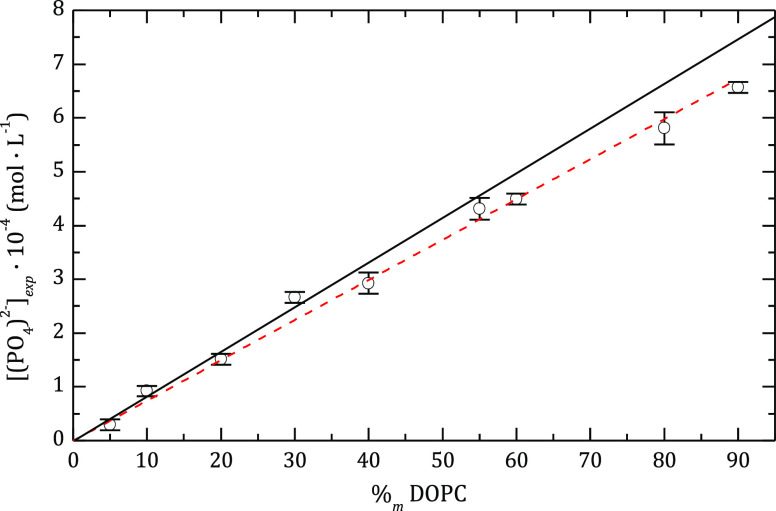
Figure 1.
Phospholipid content in the liposomes after the extrusion process (symbols), evaluated as the phosphate concentration obtained from phosphorus titration, as a function of the initial DOPC content of the mixture of phospholipids. The continuous line represents the expected values if there were no losses, and the dashed line shows the tendency of the experimental data.

